This blog is the last in a series of articles on use of Twitter “big data” to study health awareness campaigns. World Diabetes Day happens every year on 14 November. Want to know why? Scroll down to find answer in “top tweet” summaries below…

This blog is the last in a series of articles on use of Twitter “big data” to study health awareness campaigns. World Diabetes Day happens every year on 14 November. Want to know why? Scroll down to find answer in “top tweet” summaries below…

During November 2017 there was a focus on HIV testing across Europe:
Both campaigns asked me to map the tweets over the course of the week. I am not associated with or funded by either campaign. I am doing this out of interest, as a Public Health doctor, in personal time. As for previous analyses written up on the ScotPublicHealth blog I am interested to see how different campaigns unfold. Of particular interest here is how tweeters observe the geographical “boundaries” of the campaigns – for UK, Europe, worldwide. I am also interested to see whether the tweeters and tweet content differ between the different campaigns and across the week. As ever, the ideal tweet grabs attention (image), shares information (in image and text, but also linking to further information using a URL), and links to others (by mentioning other users/ tagging others in an image, and a hashtag).
I looked at the campaigns in a number of ways:
This is the first “guest blog” on the ScotPublicHealth site. Fran Kerr, Antimicrobial Pharmacist, provides the background to Hairmyres Hospital Allergy Awareness Week (#AllergyHM17), both in the hospital and on social media. Social media metrics (NodeXL map, and other tools that Fran has access to) will follow during the week.
If you’d like to contribute a blog to the ScotPublicHealth site then please get in touch with Dr. Graham Mackenzie, Consultant in Public Health Medicine.
The aim of Hairmyres Hospital Allergy Awareness Week (#AllergyHM17) is to improve assessment and documentation of patient medication allergies to reduce harm associated with the administration of medication to which the patient is allergic.

Continue reading “Hairmyres Hospital Allergy Awareness Week, 13th -17th Nov 2017: #AllergyHM17”

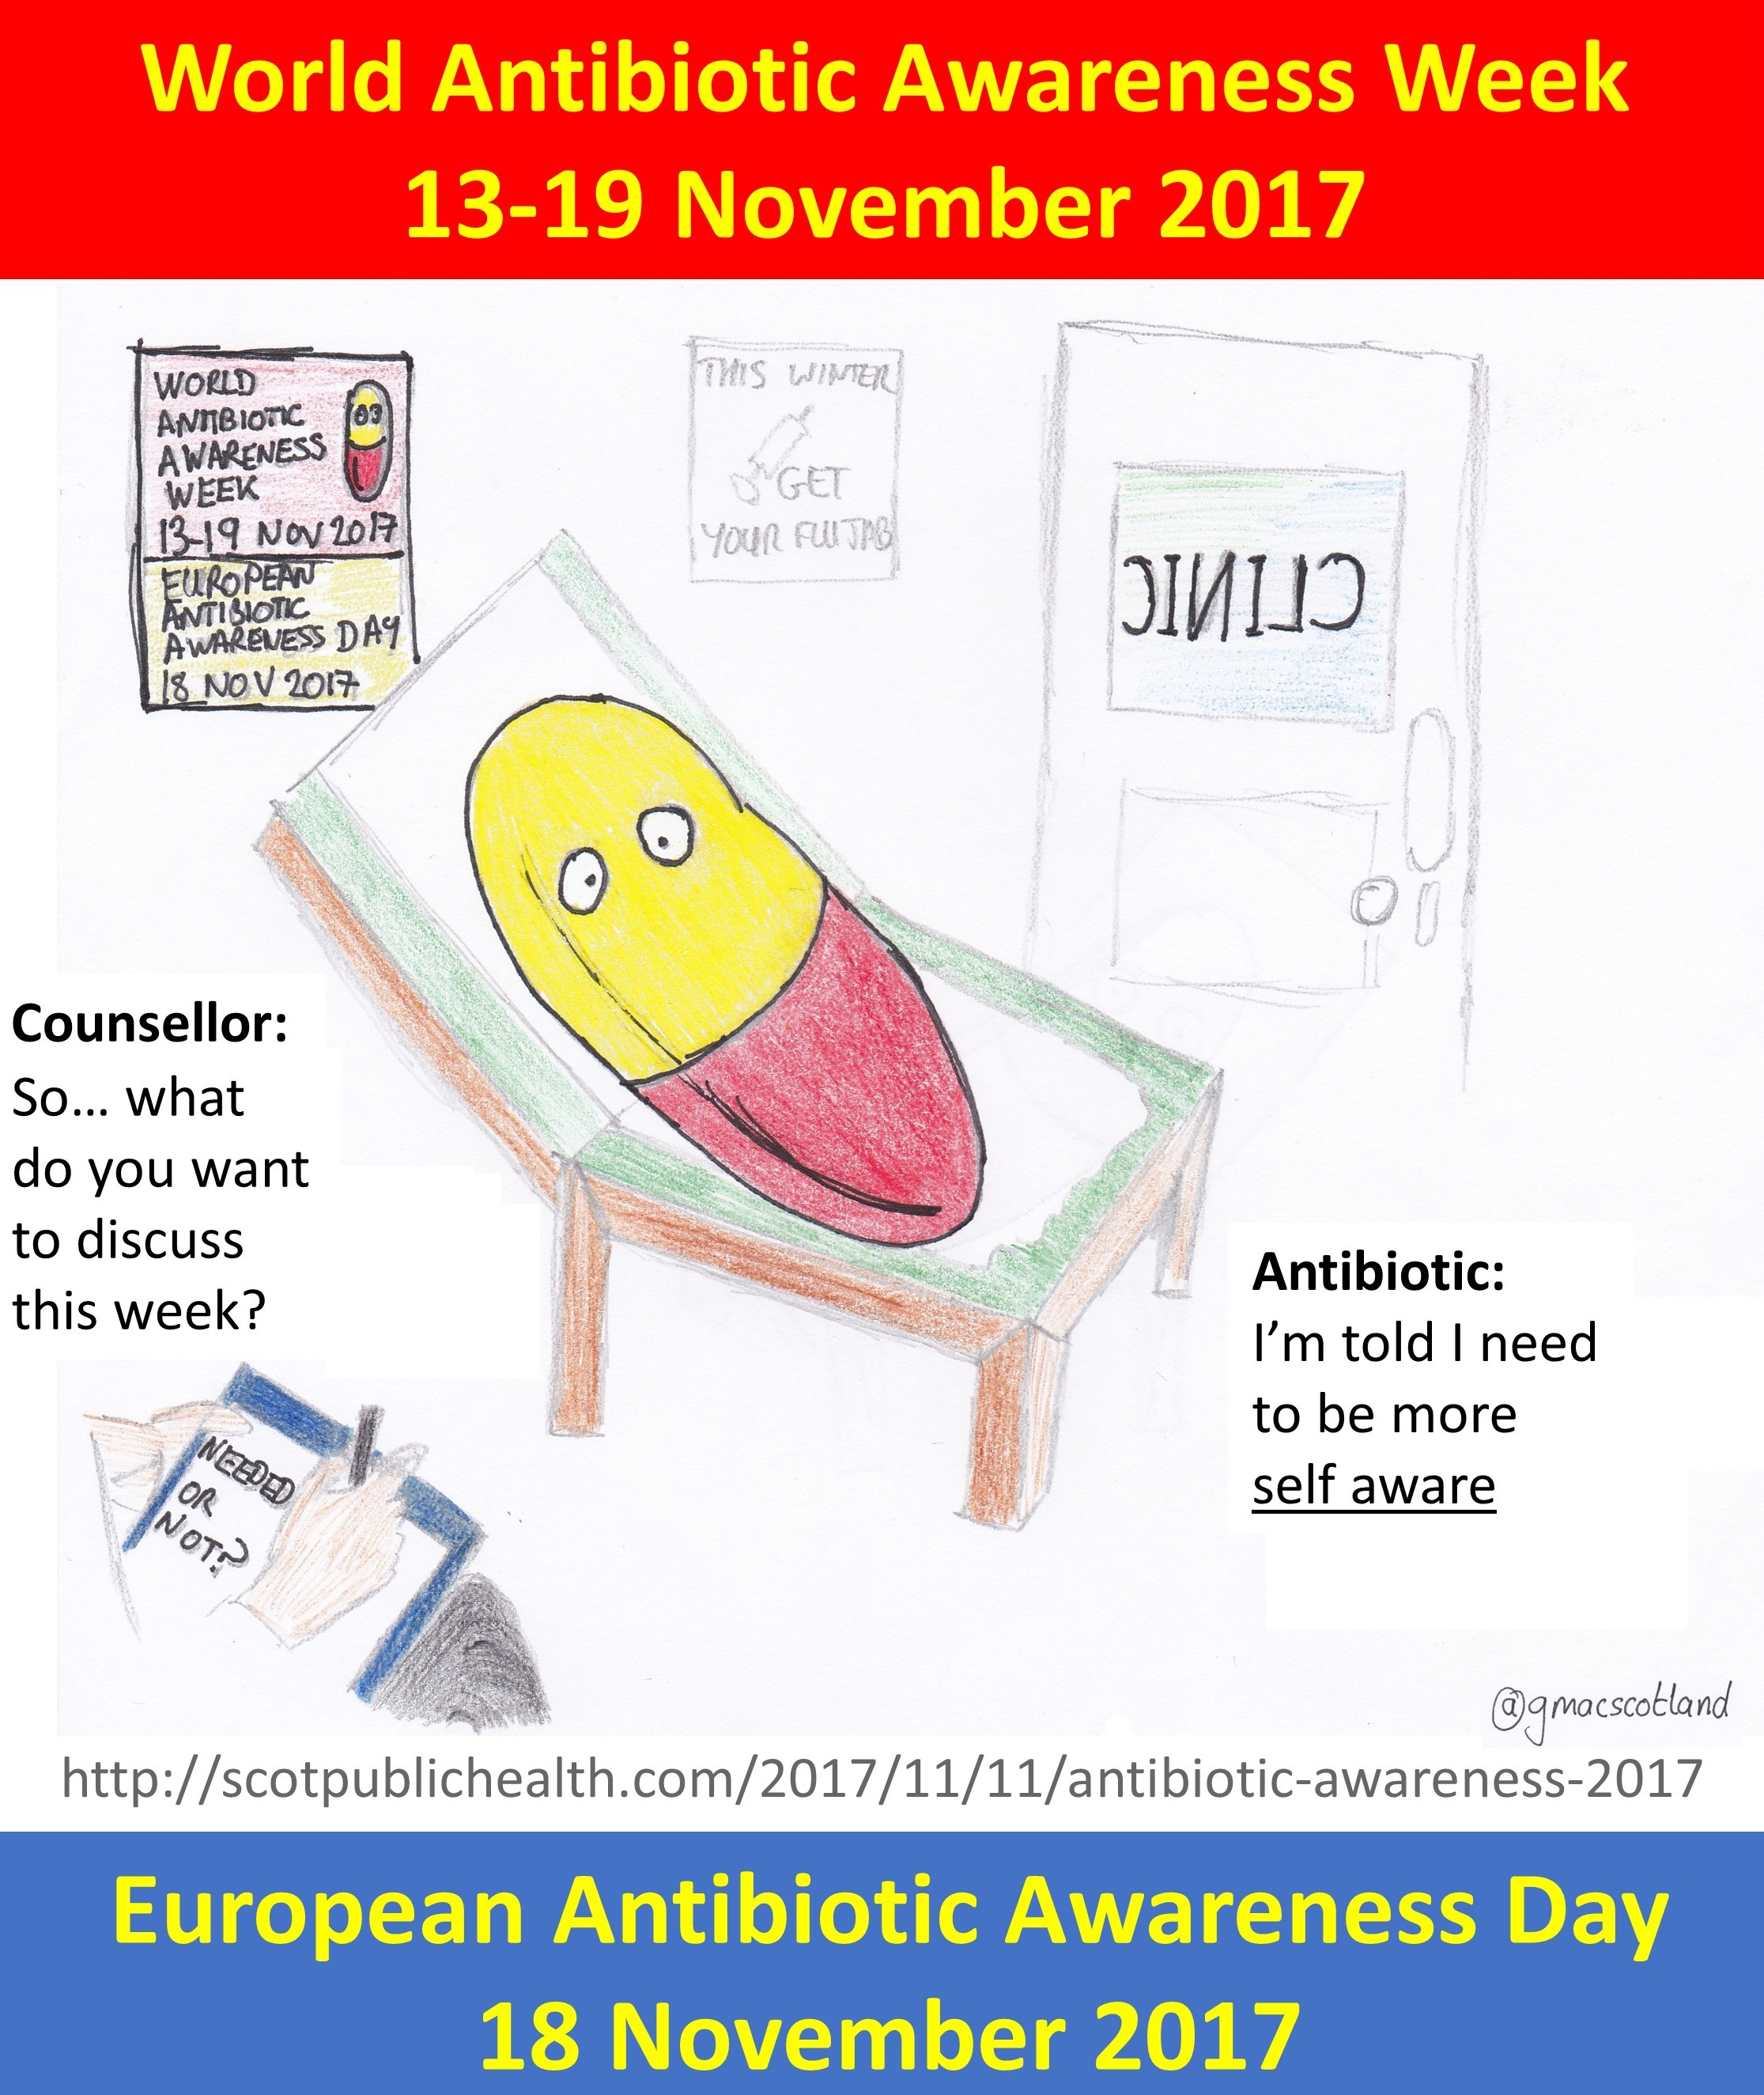
World Antibiotic Awareness Week 2017 runs 13-19 November 2017. European Antibiotic Awareness Day in on 18 November every year. Antibiotic resistance and antibiotic awareness are important public health topics. The World Health Organisation lists prevention and control measures for different sectors including individuals, policy makers, health professionals, healthcare industry and agriculture sector.
As previously discussed on this page antibiotic awareness campaigns attract a lot of tweets – professional and public facing. However it’s not clear which hashtag to use to tweet, or to search for during the week. This blog will be updated throughout the week to help you decide which hashtags to use and search for. I will summarise the top content using “big data” methods, listing the most retweeted tweets across the different hashtags.
The weekend before the campaign I ran a series of “follow the hashtag” searches (to map tweets geographically, and estimate audience) for different hashtags, and three large NodeXL social network maps. Links to these analyses, and top tweets from the NodeXL analyses are provided below. I also produced a graphic of my own to provide a personal touch that I could also track during the course of the week.
NOTE (13 September 2018): Since writing this blog Storify has been discontinued. I have therefore moved (I hope) all the summaries mentioned below to another site (Wakelet). I will need to update all the Storify links accordingly.
Introduction: ScotPublicHealth work has always had a double purpose – exploring both public health and social media techniques. This post uses social media – and social network analysis (using NodeXL) in particular – to document tweeting about health/ healthcare. It looks at top influencers at UK and global level.
I have developed an interest in social network analysis over the past year. The method allows us to look at interactions between Twitter users. It also provides a complete extract of tweets between stated time limits that can be used for further analysis in Excel.
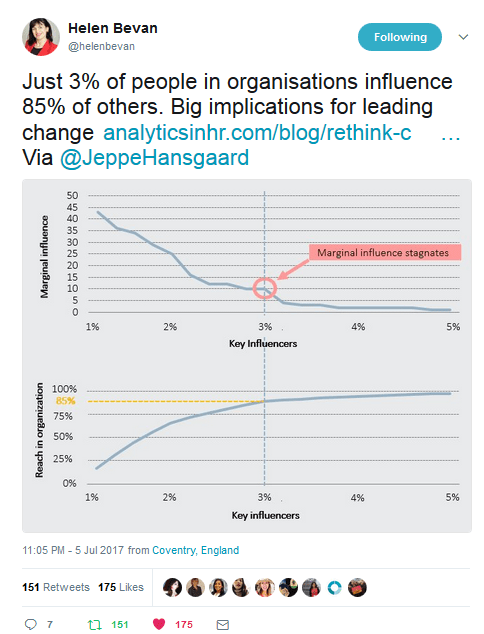
Back in July 2017 Helen Bevan’s team at NHS Horizons contacted me to see whether these methods could be used to identify the top 3% influencers around health/ healthcare tweets. I set out to refine the social network analysis methods that I had been applying to simple Twitter searches (eg around a public health awareness campaign or conference, with tweeting around a single hashtag) to answer this rather more complex question.

There were 3 main purposes to this work:
| Purpose | Uses |
| To attempt to answer the 85%:3% question and identify the key influencers | Help these tweeters understand their reach and influence
Identify other influential health/ healthcare community who may be creating useful content |
| To refine and describe the methodology | Allow others to repeat and refine the approach and apply to other questions
To allow peer review |
| To summarise the type of content identified | To understand the type of content that is achieving success, and the tweeters generating that content |
The BMJ cover story on 9 September 2017 described the response to a Twitter ban at a large conference in the US. Was this a lot of witter, a social media storm in a teacup; or did it represent censorship and a missed opportunity to learn at a conference?
(Prefer this blog as a PDF? Download it here)

Source: BMJ cover story, 9 September 2017
I started using Twitter in 2013 when “early adopters” were evangelising about its potential. I learnt by observing others and started tweeting. Following people with shared interests led to connections and further learning. However, the idea of scrolling through lots of tweets on a small device has never appealed very much.
Twitter provides a glimpse of clinical and scientific developments, often well ahead of print. Colleagues share ideas in accessible ways (eg infographics, short films, or blogs). However, the volume of information quickly becomes overwhelming. Big names across clinical specialties are on Twitter. Click from person to person, through hashtags, follow Twitter recommendations and you’ve lost an hour without much to show for it. You need a strategy to use Twitter effectively.
Conferences are a great way to start using Twitter in a more structured way. Delegates and conference organisers often start tweeting using the conference hashtag a few days in advance. You will arrive at the conference prepared, with ideas of work to search out and people to meet. However, after the conference has finished you need to have a plan about how to stay in touch and informed.
As a Public Health doctor I am interested in the big picture. The first time that I saw a social network analysis (SNA) map (of a conference via Mark Outhwaite, July 2015), I was hooked. These maps show interactions around a Twitter search term. It took me over a year to try my own maps, and another few months to understand the potential of these mystifying and beguiling green spaghetti junctions.

Source: NodeXL social network analysis of the 5 top global medical journals, 19-26 September 2017
In October 2016 I started to use SNA tool NodeXL to work through a series of topics, including conferences and health campaigns. Automated reports provide summaries including top influencers, hashtags and weblinks from tweets. However, richer information is available from the individual tweets captured by NodeXL. Sifting through tens of thousands of tweets takes a few minutes using approaches I have refined over recent months. I identify the most shared posts as a rapid means of “digital curation”: if something has been shared a lot it is either popular or controversial, so there will be something to learn. This approach gives a contemporary glimpse into the response of professionals, patients and/or public. You can access the resulting “big data” summaries even if you don’t tweet: e.g. see my summary of BMJ/ IHI International Forum on Quality and Safety in Healthcare #Quality2017.
The approaches have wider application. Studying Immunization Week 24-31 April 2017 (hashtag: #VaccinesWork which is used year-round) I was interested – and concerned – that one of the tweeters with the biggest potential audience (number of followers multiplied by number of tweets(*)) was an anti-vaccination campaigner. Some weeks his tweets had a larger potential audience than large global campaigning organisations such as the World Health Organisation and UNICEF. I used SNA to study his connections. The anti-vaccination campaigner might have had a lot of followers, and a lot of potential views, but his tweets were hardly connecting. He was howling into the void. In comparison, the global organisations, and many individual vaccine advocates, achieved a much larger number of connections with accessible, clear and evidence-based materials explaining the benefits of vaccination for a general audience. The full analysis is available on my blog.
(*) Go to “get analytics” at bottom of Symplur page and set dates you want to study.
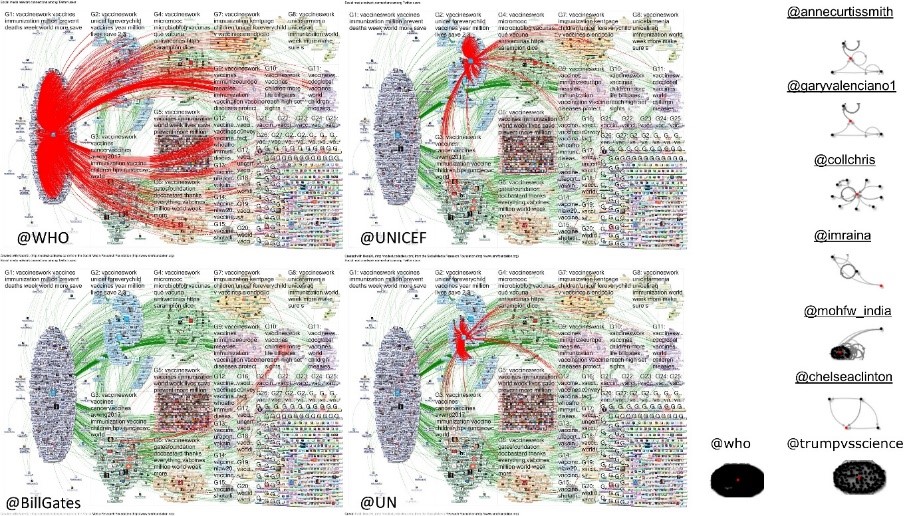
Source: #VaccinesWork tweets using NodeXL.
In addition to searching for hashtags it is also possible to use NodeXL to study people, organisations, weblinks and words and phrases on Twitter. This approach can be deployed to look at specific questions – for example to study the considerable social media impact of the BMJ cover story on the conference Twitter ban. The method is also useful in keeping up to date with top medical journals more generally. A recent search (19-26 September 2017) identifies top content from almost 23,000 tweets by over 13,000 tweeters. The resulting top 50 summary includes videos of clinical examination (including an ocular trematode featured in NEJM), clinicians’ responses to journal articles and tightly worded summaries, with weblinks to clinical and academic content from across these journals.
Julio Mayol, an early adopter of Twitter in his work as Professor of Surgery, writes about Twitter and surgical research in the December 2017 issue of BJS, but his points refer equally to surgery and clinical work more generally (see list below). The issue’s front cover features one of my NodeXL maps, after being approached by the journal’s social media champion, surgeon Richard Brady on 15 October, after an initial suggestion from Jonothan Earnshaw. As captured in a subsequent NodeXL map, BJS and Julio’s tweets about the article and journal issue feature prominently in tweets by and about surgical journals in November. Indeed 11 tweeters in that more recent NodeXL map achieve 85% of the retweets on that map (out of 146 tweeters). The speed of publication, and the journal’s interest in social media, social networks, and infographics, is impressive, and is amplified by the work of individual surgeons like Julio and Richard.

Twitter therefore has huge potential for healthcare workers for CPD and networking, and to study their impact if active on Twitter. However, you don’t even need to be on Twitter to access this content. The approach to digital curation described here can provide an up-to-date view of the medical and scientific world, driven by and feeding an endless curiosity and desire to learn. To see this work moving from niche interest/ hobby to the front cover of two global publications (BMJ and BJS) over a period of 3 months is exciting, and the interest looks set to continue with a paper on my work on conference tweeting in press for January 2018. Meanwhile, I have stopped actively tweeting, concentrating instead on finishing my studies of health and healthcare tweeting without influencing the topics that I am studying.
Dr Graham Mackenzie, Consultant in Public Health, NHS Lothian, 6 November 2017; updated with paragraph on Julio Mayol and BJS, and the final two sentences of article, on 19 November

Links: My further outputs from NodeXL analyses are available at my ScotPublicHealth blog and Storify page, and these are updated regularly.
I have no conflicts of interest to declare. This work has not been funded externally. I would like to thank Marc Smith and his colleagues at SMRF for their help in getting NodeXL set up on my computer and their ongoing input in refining and developing their software and helping me improve my analyses.
Thanks to Julio Mayol for his kind words about this blog:


Antimicrobial resistance presents a major challenge, but simple steps can to minimise the impact. Social media has a role in disseminating information during antibiotic awareness campaigns: information can be shared rapidly, widely, and cheaply.
Hashtags are used to identify social media posts on a specific topic. The official hashtag for social media activity during the 2016 world antibiotic awareness week (14 to 20 November 2016) was #AntibioticResistance, with a separate hashtag for the official European campaign on 18 November 2016 (#EAAD or #EAAD2016).
However, numerous other hashtags were used quite widely during the week, including hashtags for established professional-focused national campaigns such as #AntibioticGuardian, which originated in the United Kingdom (UK), and an unofficial hashtag that reflected the purpose of the week – #AntibioticAwarenessWeek. There was also some tweeting without hashtags. There were many tens of thousands of tweets posted during the campaign week by tens of thousands of individuals and organisations.
It would not be possible to analyse this volume of tweeting using conventional methods. Accordingly, we extracted data using social network analysis (NodeXL) and Twitter searches to study the characteristics of tweeters and tweets using the most frequently used hashtags (official and unofficial) and without hashtags. An example NodeXL map is shown in Figure 1.
The quality of the most popular tweets was assessed by looking at use of hashtag, image or mention of another tweeter. These are components that boost the impact of a tweet as described in the previous ScotPublicHealth blog post.
The aim of the analysis was to identify whether there were differences in tweet content between the hashtags, to see if there is value in looking beyond the official hashtag, both for learning, networking and broadcasting.
