
This blog is the last in a series of articles on use of Twitter “big data” to study health awareness campaigns. World Diabetes Day happens every year on 14 November. Want to know why? Scroll down to find answer in “top tweet” summaries below…
This is a work in progress, shared in a preliminary form in a hope that others across the world will find this information useful, and will contribute to the further analysis of the big NodeXL extract provided below.
As we have seen in previous posts on this page, global health awareness campaigns can have a huge response on social media, from press, public, patients and professionals alike. Some of the top tweets will contain carefully tailored messages and images that will be shared in synchronised fashion by global health organisations and then by their followers and others interested in the topic. Other tweets will be more spontaneous: personal, topical, reactive or humorous. Tweets that are shared widely are likely to be timely, attractive, informative and either strike a chord or controversy.
Identifying the messages that have been shared widely (by “retweets”) will help campaign organisers understand which of the official messages worked best. It will also help identify other popular content that could be incorporated into future campaigns, or controversies that need to be addressed. Understanding the key influencers will also be helpful for disseminating information in the future.
I attempted this analysis last year, but I had only just started using NodeXL at that point and had limited PC processing power to extract and analyse the campaign, not least because I was also studying World Antibiotic Awareness Week (which I am studying again this year). NodeXL can extract tweets up to 9-10 days after posting, but I did not manage to acquire a full enough body of tweets for analysis. Having acquired new skills over the course of the year I was able to obtain a fuller extract for the 2017 campaign.
I had attempted to extract tweets during and immediately after the campaign (14 November), but Twitter was not releasing a reliable flow of tweets to NodeXL. As noted in the previous blog:
Access to Twitter is rather like a garden hose on full blast with a bunch of people dancing about around it – sometimes people step on the hose and the flow reduces to a trickle; other times it’s like a geyser catching everyone.
A tweet posted before the period extracted by NodeXL will appear in the extract if it is retweeted during that period. This allows us to identify the most popular content, but will underestimate the overall volume of tweeting.
For the 2017 campaign I extracted tweets using four main approaches as detailed in the table. I combined the 9 searches performed on the morning of Saturday 18 November in NodeXL (this was a first attempt at combining searches for me). I intended to look at a period of 36 hours from 6PM on 13 November to 6AM on 15 November (UK times) to capture tweets from the day of the campaign across the world. The number of tweets identified in the extracts tailed off after midnight 15 November (unsurprising given the timing of the extracts obtained) so I only included a few tweets after that point. I identified the three most retweeted posts for each hour over 33 hours, adding a final tweet to make a list of 100 tweets. I removed spam, offensive posts, misleading advice and duplicates. I then repeated the exercise, this time looking at the most retweeted posts overall (ie for full period, not for each hour).
| Period \ Search | #WorldDiabetesDay | “World Diabetes Day” | #WDD OR #WDD17 OR #WDD2017 |
| 13 November | 24 hours | 8 hours 45 mins
(15:14 to 23:59) |
24 hours |
| 14 November | 5 hours
(19:01 to 23:59) |
6 hours 30 mins
(17:32 to 23:59) |
24 hours |
| 15 November | 4 hours
(20:02 to 23:59) |
2 hours
(21:47 to 23:55) |
24 hours |
The final (tenth) search was for @wdd (tweets by, replying to or about the World Diabetes Day campaign Twitter account): 10-day, 9-hour, 5-minute period from Sunday, 05 November 2017 at 12:42 UTC to Wednesday, 15 November 2017 at 21:48
I identified 9,895 tweets which were retweeted 48,942 times. I excluded 16 tweets either because I could translate them using the Twitter translate feature, or because they were spam or offensive. These 16 tweets were retweeted a total of 2,597 times. The NodeXL report for the full extract can be viewed here: combined search. The Excel file at the end of that report provides access to the full extract for future analysis.
The Symplur website estimates that there were almost 75k tweets and retweets using #WorldDiabetesDay, almost 15k using #WDD and 6k using #WDD2017 (Appendix 1). These figures are well above the limit allowed in social network analysis tools such as NodeXL and TAGS (limit 18,000 tweets). #WDD17 had not been registered on Symplur so an estimate is not available. Symplur does not provide an estimate of tweets for plain language search (eg “World Diabetes Day”). This is substantially more than the number identified using NodeXL (almost 10k tweets, retweeted almost 50k times), though of course that looked at a shorter period for some of the searches (table above).
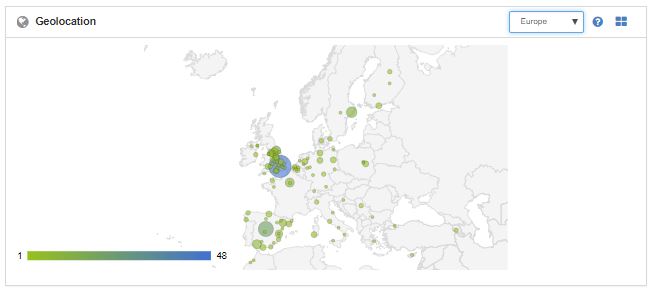
The FollowTheHashtag website provides estimates for any Twitter search term, including tweets (further split into tweets, replies, retweets), contributors, impressions and audience. Unfortunately the information is typically only available for 1,500 tweets, so it provides only a snapshot for a campaign of this size. As discussed in the recent World Antibiotic Awareness Week blog, the estimates of impressions and audience are likely to be a very considerable overestimate. Nonetheless, the breakdown by geography and gender is potentially useful (Appendix 2): for the periods stated (typically after the campaign day itself), the abbreviated hashtags (#WDD, #WDD2017) were used more widely across Europe and other areas than the full hashtag (#WorldDiabetesDay) or phrase (“World Diabetes Day”). The abbreviated hashtags were concise and specific and overcame language barriers that may have limited use for the longer terms.
The NodeXL analysis provides information about interaction, tweeters, hashtags, URLs and more. The main influencers (by connectedness) were @diabetesuk, @nickjonas, @jdrf, @wdd, @ellierosehuckle, @businessinsider, @who, @norm, @jdrfuk, @diamond37. “Betweenness centrality” is quite a different measure to the “popularity” of a tweet, eg measured by number of retweets – people can be well connected (eg lots of interactions and mentions, including with people outside their usual follower group) without necessarily receiving large numbers of retweets). There are very considerable connections in the map, but there are also massive “brand clusters” – the “fragmented” tweets in the top left and bottom right of the map – where people are mentioning the campaign without connecting with other people. Read more about the types of clusters in this Pew Research/ Social Media Research Foundation post.
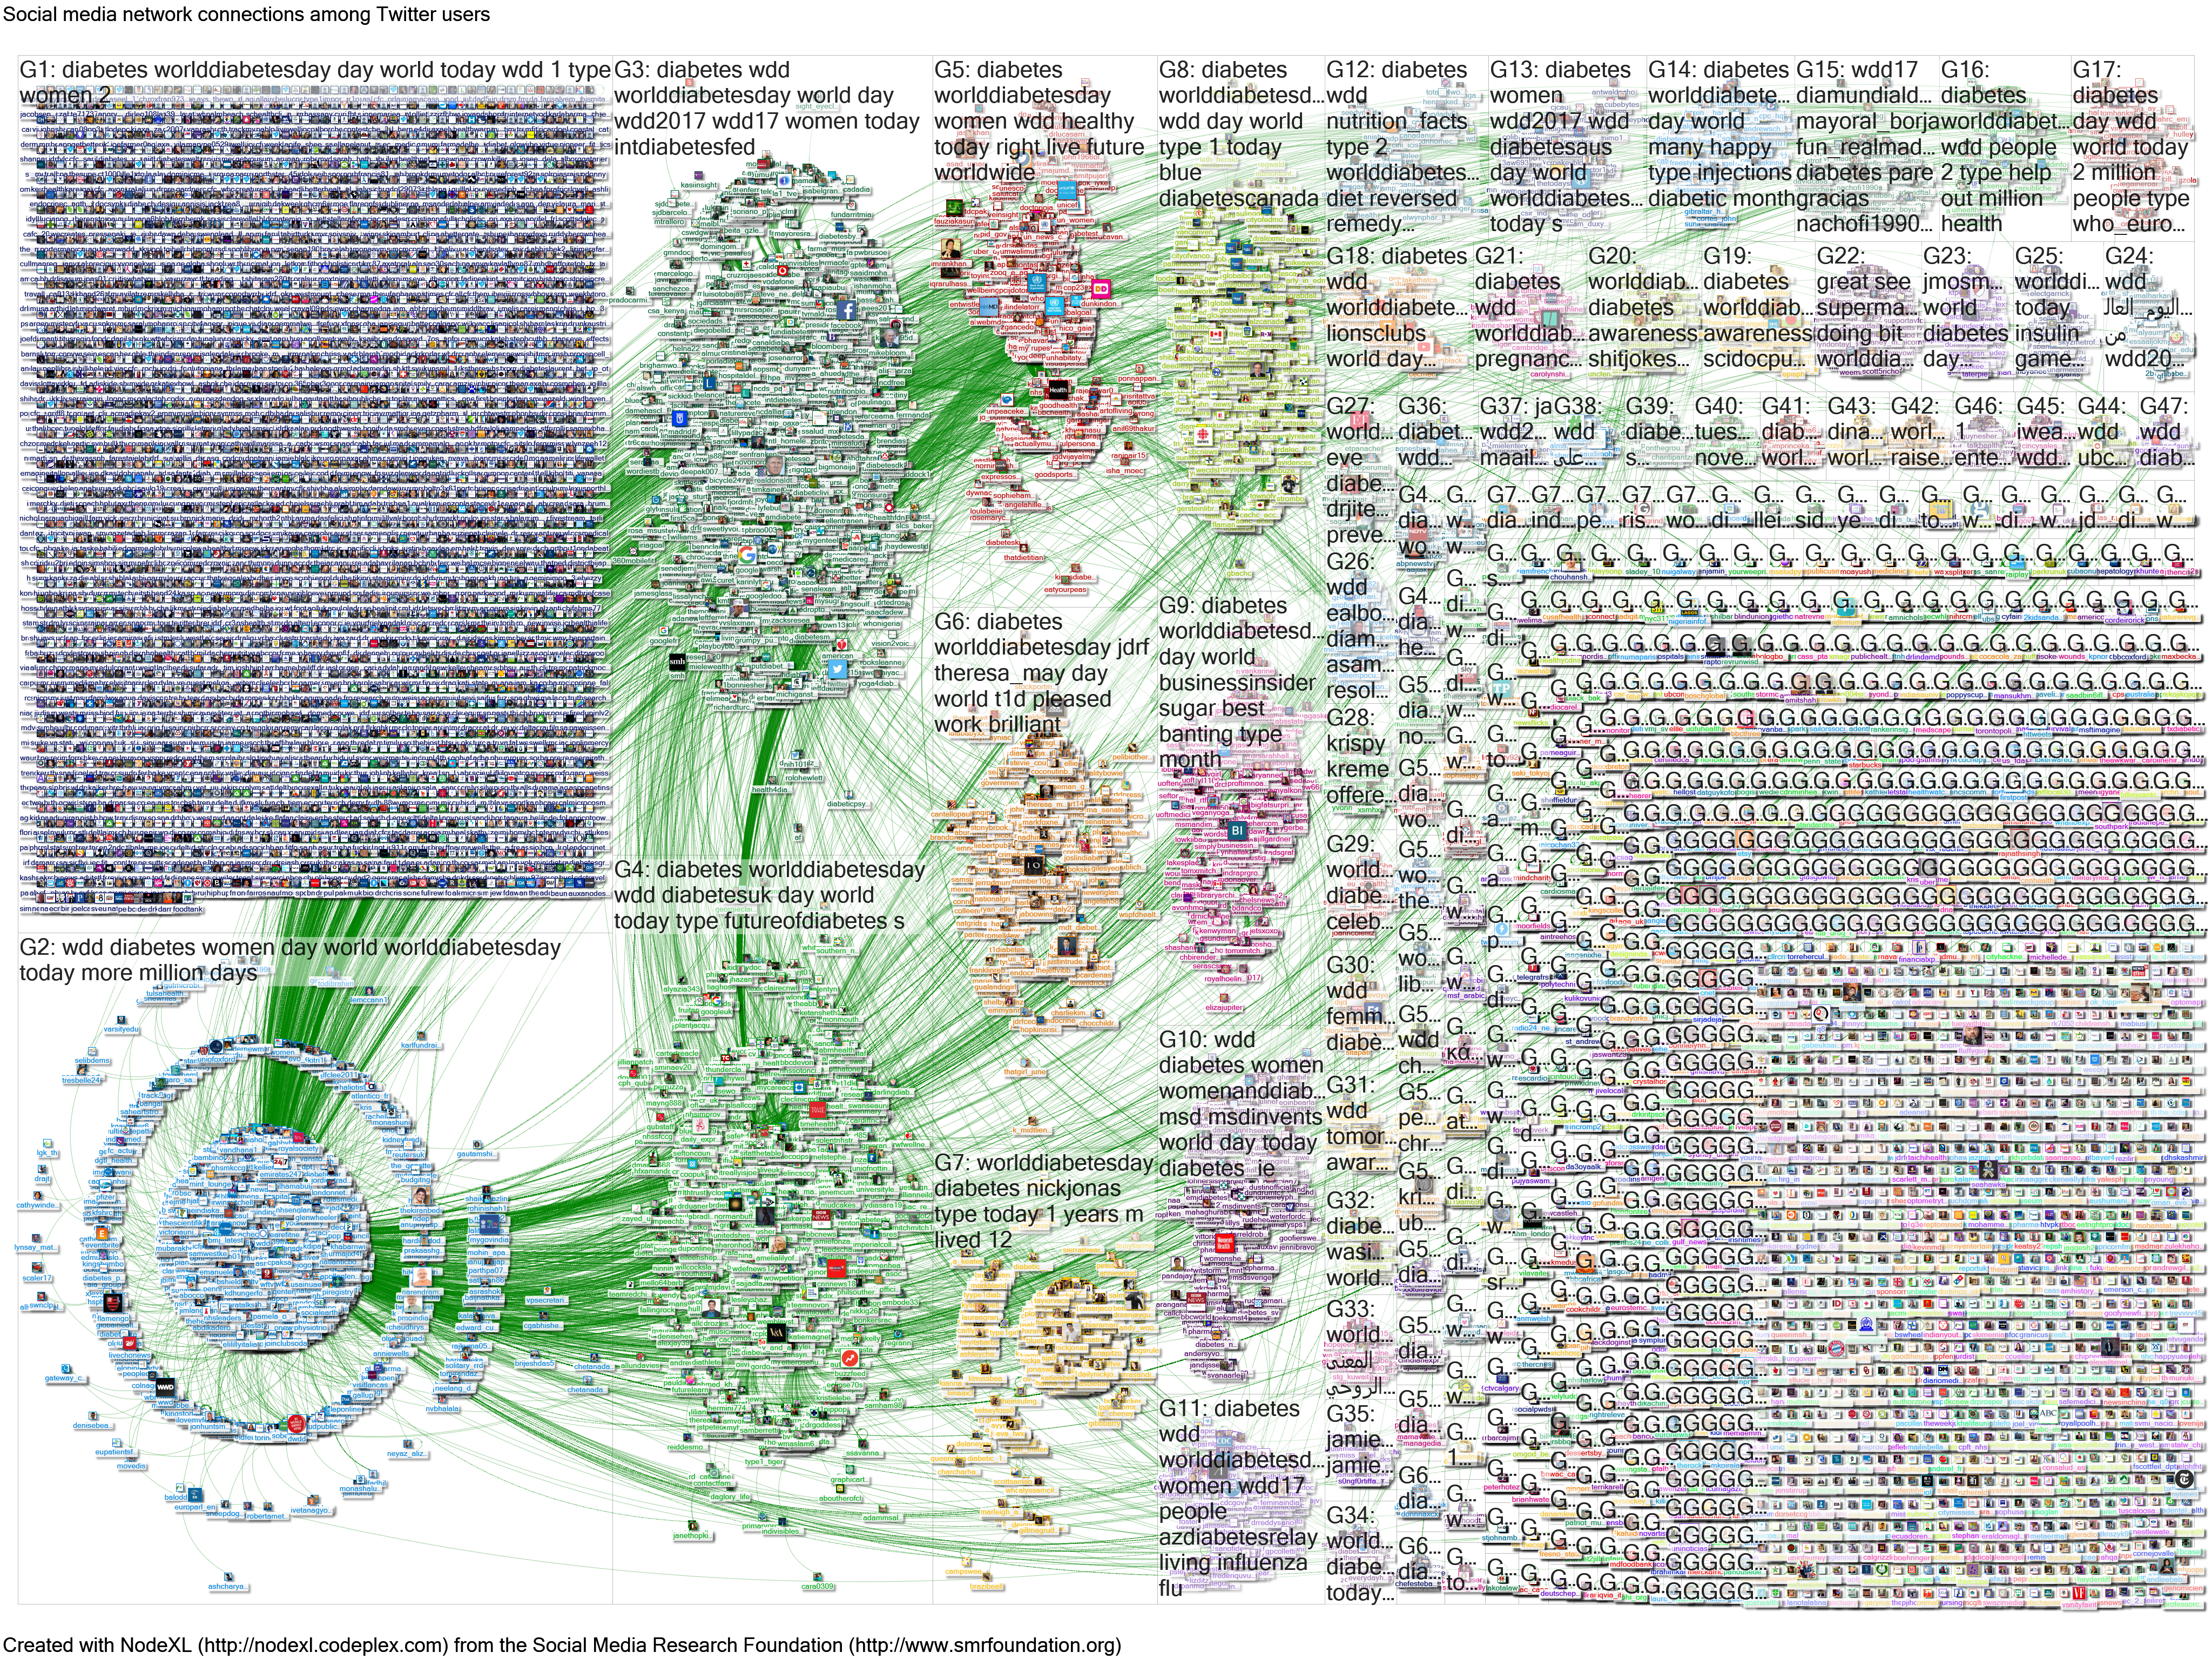
Source: Combined search on NodeXL
I have summarised the tweets in two ways:
- An hourly summary: three top tweets per hour over a 33 hour period, plus a further tweet to make 100 tweets (100 tweets, 85 tweeters, median 84.5 retweets, range 8-2,674 retweets, interquartile range 26.5-171 retweets)
- An overall summary: taking the top tweets by retweets for the full period (100 tweets, n=80 tweeters, median 112 retweets, range 62-2,674 retweets, interquartile range 75.5-196 retweets).
- I will add another summary to list the 41 tweets that the hourly summary identified that were not included in the overall summary – that will give a sense of whether the extra work involved in this approach is worthwhile.
You can flick through the summaries to see the top tweets (text, image and video) and the number of interactions that these tweets have achieved. The figures will change over time – as will the rankings – as some of the most popular tweets will continue to engage. There is an eclectic mix within the summaries – organisations, individual professionals, patients, pressure groups, comedians and many others. More details will become available over time, ideally adding tweets from 15 November to the extract to study the campaign in the Americas (I expect that there was a considerable volume of tweeting by individuals and organisations during the afternoon and evening – ie midnight to noon on 15 November, UK time, and the analysis so far will not have captured that).
#WorldDiabetesDay was clearly a very busy campaign, with an impressive level of planning and a positive response across the world. The number of tweets is beyond the capacity of existing social network analysis tools, at least in the heat of the campaign:
- NodeXL achieved a partial extract, but its ability to capture tweets and retweets during the extract window allowed the identification of a spread of tweets from across the whole day of the campaign, across the world.
- TAGS would be another option, updating the extract every hour, but it would be much more time consuming to identify the “top tweets” using this approach, limiting its use in the period immediately after a campaign. I did not use TAGS this time because I was using it to study World Antibiotic Awarenes Week, but that would be an option for next year having seen the volume of tweets.
- Other tools (FollowTheHashtag and Symplur) provide a snapshot, but do not capture the interactions.
This is a starter for ten. I will update this analysis as more data becomes available. I will attempt to extract a more complete record of the day using NodeXL. I will then update this blog with more findings.
Dr Graham Mackenzie, Consultant in Public Health, NHS Lothian, 20 November 2017 and updated throughout the campaigns.

Featured image is from a tweet posted by @ProfTruby
Appendices
Appendix 1: Symplur statistics
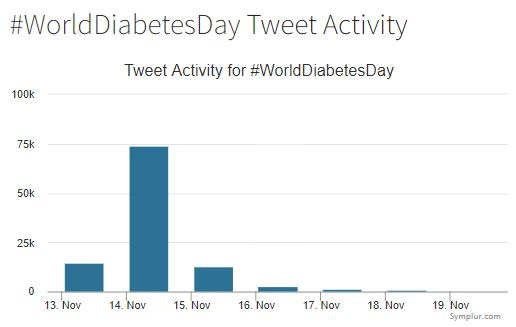
https://www.symplur.com/healthcare-hashtags/worlddiabetesday/
(NB “tweets” here = tweets + retweets)
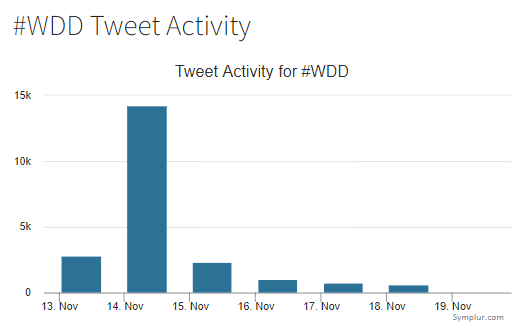
https://www.symplur.com/healthcare-hashtags/wdd/
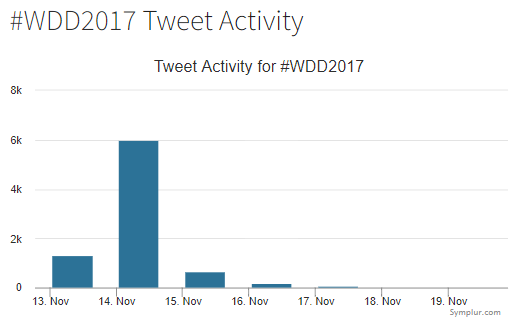
https://www.symplur.com/healthcare-hashtags/wdd2017/
Challenge of different messages for different types of diabetes
Appendix 2:FollowtheHashtag statistics
World Diabetes Day
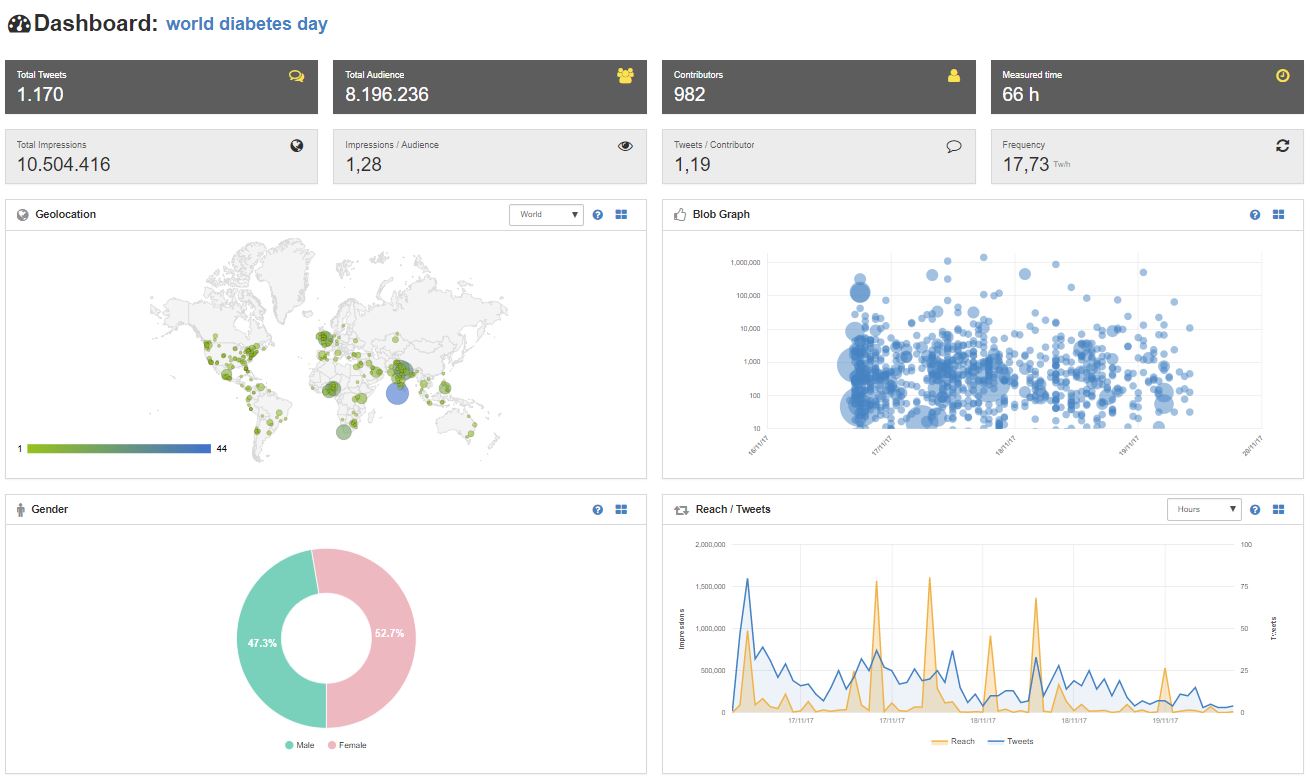
Source: Follow The Hashtag World Diabetes Day report
#WorldDiabetesDay

Source: Follow The Hashtag #WorldDiabetesDay report
#WDD17

Source: Follow The Hashtag #WDD17 report
#WDD2017

Source: #WDD2017 report
#WDD
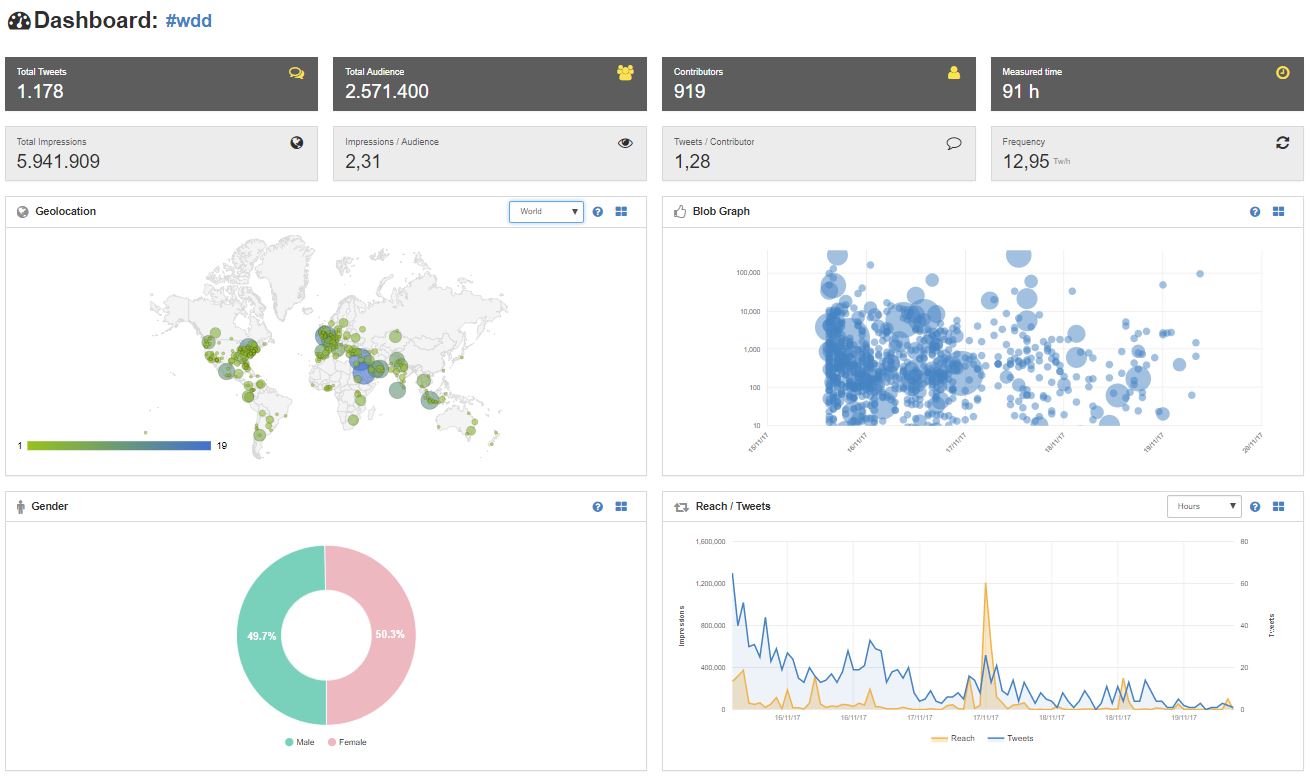

Source: Follow The Hashtag #WDD report
