Summary of World Antibiotic Awareness Week / European Antibiotic Awareness Day November 2020

This is a brief first look at the WAAW / EAAD 2020 campaign week that I prepared shortly after the campaign week ended. I did not share it at the time as other work took priority (clinical work and training commitments during the second wave of the Covid-19 pandemic). I have posted it here for interest so that lessons can be learnt for the 2021 campaign

Methods

This summary of WAAW/ EAAD 2020 looks at the 8-day period from noon on Tuesday 17 November to noon on 25 November 2020 (UTC). This period captures tweeting across the full week allowing for international time zones.

Data were collected with TAGS (https://tags.hawksey.info/get-tags/) using the following search strategies. Searches 2 and 3 were run from mid-point in campaign, collecting tweets retrospectively, providing full coverage of the 8-day period (Table 1).

Table 1. Search strategies applied across period noon Tuesday 17 November to noon on 25 November 2020 (UTC)

Search 1Search 2 (added after preliminary examination of search 1 results mid campaign)Search 3 (plain English terms)
#eaad #eaad2020 #eaad20 #waaw #waaw20 #waaw2020 #antibioticresistance #antibioticguardian #keepantibioticsworking #antibioticawareness #worldantimicrobialawarenessweek #worldantibioticawarenessweek #antibioticawarenessweek #stopsuperbugs #aaw2020 #aaw20 #waawafrica #antimicrobialresistance#stopdrugresistance #NOValenParaTodo #ncasaaw2020 #usaaw20 #beantibioticsaware #youthstewardsofamr #youthagainstamr #antibióticos  “antibiotic resistance” “antibiotic guardian” “keep antibiotics working” “antibiotic awareness” “antimicrobial awareness” “antibiotic awareness” “stop superbugs” “antimicrobial resistance” “stop drug resistance” “be antibiotics aware” “youth stewards for amr” “youth against amr”  

Data were then re-collected using the 19-digit unique tweet identifier in NodeXL, on 27/11/2020. The NodeXL report and map can be viewed here: http://nodexlgraphgallery.org/Pages/Graph.aspx?graphID=242304. Data are available from Graham Mackenzie on request, as the file was too large to upload to the NodeXL Graph Gallery.

NodeXL records information on tweets and retweets, tweeters and retweeters, Twitter accounts mentioned in tweets (either in replies or body of tweet), and hashtags. Further information is available from the 2018 campaign: https://www.sciencedirect.com/science/article/abs/pii/S0924857920304209, and NodeXL data are available for campaigns since 2016, albeit with different search strategies.[1]

Results

Overall, 6533 tweeters posted 16,361 tweets, receiving 38,817 retweets.

Of these tweeters 628 (9.6%) received 80% of all retweets from their 5,966 tweets, while 3,353 (51.3%) received no retweets from their 4,605 tweets.

Looking just at tweets using #AntibioticGuardian (as per request by a co-author on earlier papers)[2], there were 412 tweeters who posted 986 tweets, receiving 1,731 retweets. Of these, 57 tweeters (13.8%) received 80% of retweets from their 393 tweets while 191 tweeters (46.4%) received no retweets from their 237 tweets.

The top 20 hashtags overall on the basis of retweets are listed in Table 2.

Table 2. Top hashtags by number of retweets received

HashtagNumber of RTs receivedNumber of tweets posted
#antimicrobialresistance11,0283,131
#waaw202010,5834,134
#amr6,3712,519
#waaw6,1412,302
#keepantibioticsworking4,3231,661
#antibioticresistance3,8641,492
#worldantimicrobialawarenessweek3,2471,291
#eaad2,943764
#antibiotics2,7011,076
#africawaaw2,603929
#covid191,893484
#antibioticguardian1,731986
#antibióticos1,627434
#stopdrugresistance1,547187
#worldantibioticawarenessweek1,266230
#onehealth1,225469
#antibioticawarenessweek1,204788
#beantibioticsaware1,188869
#usaaw201,117769
#stopsuperbugs875289

Source: NodeXL, searches 1-3, noon on Tuesday 17 November to noon on 25 November 2020 (UTC)

Tweets frequently included more than one hashtag as shown in Figure 1.

Figure 1. Number of hashtags used in tweets

Source: NodeXL, searches 1-3, noon on Tuesday 17 November to noon on 25 November 2020 (UTC)

The top 30 tweeters by number of retweets received are listed in Table 3.

Table 3. Top 30 tweeters (by retweets (RTs) received)

TweeterRTs receivedTweets posted% of RTs receivedCumulative  % of RTs receivedFollowers
@who2,774367.1%7.1%8,624,400
@nobelprize73531.9%9.0%721,134
@cdcgov634121.6%10.7%3,385,741
@prangob614171.6%12.3%5,234
@fao580111.5%13.7%408,836
@ncdcgov402241.0%14.8%1,161,132
@drdianeashiru373791.0%15.7%5,918
@oieanimalhealth352330.9%16.7%20,170
@africacdc323440.8%17.5%99,989
@kkmputrajaya30630.8%18.3%1,007,989
@kkeshksa29510.8%19.0%38,701
@un28930.7%19.8%13,213,333
@cw_pharmacists256450.7%20.4%3,294
@whosrilanka246300.6%21.1%7,563
@drtedros24670.6%21.7%1,358,519
@tumainimakole225860.6%22.3%4,116
@compoundchem22110.6%22.9%84,764
@_facesa212670.5%23.4%5,997
@unep21150.5%23.9%1,070,092
@whoafro210160.5%24.5%219,555
@pfizer20490.5%25.0%338,370
@bsacandjac193210.5%25.5%7,192
@eaad_eu180270.5%26.0%4,120
@spectrummd178430.5%26.4%444
@phe_uk17460.4%26.9%426,578
@wellcometrust173180.4%27.3%187,065
@hselive166140.4%27.8%160,570
@reactgroup165360.4%28.2%3,607
@ema_news164110.4%28.6%53,214
@asoantibiotics153210.4%29.0%1,687

Source: NodeXL, searches 1-3, noon on Tuesday 17 November to noon on 25 November 2020 (UTC)

The top 100 tweets on the basis of retweets received are listed in the following Wakelet summary: https://wakelet.com/wake/KBSc6At7WT-FzECPxweKD (100 tweets posted by 60 Twitter accounts including the following languages: English, Spanish, Japanese, Malay, Arabic and Tamil).

Further analysis of these data –– e.g. the breakdown by tweeter, retweeter and mentioned accounts; multivariable analysis using approach from 2018 campaign (peer reviewed paper here) –– would be possible using the data collected, but would take time.

The main lesson for the 2021 campaign is that we need more hashtag discipline for public health campaigns – hashtag drift dilutes messages, and risks missing otherwise high quality content. Use of additional hashtags can help Twitter users identify content of interest within the large number of tweets posted for a campaign, but that requires careful planning and coordination. Monitoring Twitter activity during such campaigns requires vigilance as new hashtags can emerge during the campaign.

Dr Graham Mackenzie, GP trainee, @gmacscotland 28/11/2020


[1] NodeXL has archived historical reports but I have the data saved. The 2017 data have limitations as NodeXL had not increased character count from 140 to 280 characters at that point – Twitter changed rules early November 2017. The more recent ability to run NodeXL analysis from tweet IDs would allow these data to be re-analysed with full character count.

[2] Excluding tweets that used just #antibioticguardianafrica, #antibioticguardianaward, #antibioticguardianawards, #antibioticguardianawards2020, #antibioticguardians, #antibioticguardianship as these would not be identified using Twitter search for #AntibioticGuardian

Quality improvement – applications in General Practice, planning for end of pandemic

Summary: This blog presents a summary of Quality Improvement methodology and applies it to a question highly relevant to General Practice – how to move away from same day appointments as Covid-19 lockdown loosens, but without overwhelming services. It focuses in on mental health – with an example sequence of PDSA cycles solely for illustrative purposes. It shows how a series of patient encounters (in this case calls to reception to make GP appointments) represents an opportunity for rapid testing, developing an approach that meets the needs of patients and potentially taking pressure off GPs while also providing more patient centred care. The ideas are presented for discussion rather than as a fait accompli. In real life the process of scoping and running a QI project with a team throws up lots of surprises and shakes a lot of assumptions.

I wrote this blog while reflecting on recent discussions with colleagues in a number of settings. It is presented here as a “think piece”, and will hopefully generate discussion in the comments box below. What are your experiences of using QI methods in general practice and other clinical settings?

Dr Graham Mackenzie GP specialty trainee, year 3 of training

Continue reading “Quality improvement – applications in General Practice, planning for end of pandemic”
Hashtags from all tweets in the extract (n=31,031 hashtags from 10,604 tweets)

World Immunization Week 24-30 April 2020: A rapid review of pro- and anti- vaccination activity at the peak of the COVID-19 pandemic

I wrote this piece at the start of May 2020. It wasn’t accepted by a peer reviewed journal at that time, so I am providing it here as a blog instead. You can read the accompanying Wakelet summary of tweets (pro-vaccination) here.

Abstract

Public attitudes on vaccination are of interest during the COVID-19 pandemic. Social media activity provides a route to unprompted views on vaccination. This study captures global tweeting during the World Immunization Week 24-30 April 2020, with a particular focus on describing the antivaccination content but avoiding identifying the tweeters or the individual tweets to avoid disseminating their views further.

Tweets using the official campaign hashtag #VaccinesWork and related terms including plain English phrases (“World Immunization Week”) and hashtags (e.g. #WorldImmunizationWeek) were extracted using an online social media tool (TAGS). Tweets and retweets were then imported into the NodeXL Excel extension at the end of the week to obtain the most up to date data on number of retweets received, hashtags used and characteristics of tweeters and retweeters. The top 200 tweets based on retweets were identified and antivaccination posts (n=5) used to identify tweeters and retweeters, repeating this six times and performing a further search based on commonly used antivaccination hashtags.

In total there were 10,946 tweets by 6,264 tweeters, with 53,124 retweets by 32,445 retweeters. The great majority of the most popular tweets were pro-vaccination. However, after an analysis of the most popular antivaccination posts, the accounts retweeting these posts, and the specifically antivaccination hashtags used, 218 antivaccination tweets were identified, posted by 89 tweeters, with 724 retweets made by 518 retweeters. These tweets disseminated common antivaccination myths, including material that inverted comments by senior officials to dispute vaccine safety/ efficacy.

This rapid analysis captures and describes some of the most popular pro- and anti-vaccination tweets from the April 2020 World Immunization Week, helping understand public views on vaccination globally at the height of the COVID-19 pandemic.

The full analysis is provided below, including word clouds of hashtags used by the different communities. You can also download this as a PDF file.

Funding: No external funding

No conflict of interest

Dr Graham Mackenzie, MD FRCP(Edinburgh), @gmacscotland on Twitter (4 May 2020, updated 10 April 2021)

Continue reading “World Immunization Week 24-30 April 2020: A rapid review of pro- and anti- vaccination activity at the peak of the COVID-19 pandemic”

Adventures in social media analysis for understanding healthcare and public health topics.

Between 2016 and 2021 I have been exploring how to use social media and social network analysis to understand healthcare and public health topics. The list of peer reviewed papers and blogs below (click “Continue reading” below) – and the brief description beneath each reference – provides a summary of this work. I have tried to keep each publication original, making new discoveries and advances along the way. Hopefully these publications, and the blogs and pages on the ScotPublicHealth site, will help others make further advances over time, and also understand the pitfalls in social media analysis.

Thank you to all co-authors who have helped make this such an enlightening and enjoyable body of work. It has been a truly international collaboration, across multiple clinical fields, with new connections from Hong Kong, across Europe, and North America, plus Australasia and South America along the way in conference abstracts and social media conference summaries.

This concludes planned work on this topic, though I do have a lot of data saved – e.g. on #FOAMed, #VaccinesWork, #Covid19UK and other topics, that could be analysed more fully at a future date.

Dr Graham Mackenzie, GPST3, Edinburgh, Scotland

May 2021

graham mackenzie on twitter
Continue reading “Adventures in social media analysis for understanding healthcare and public health topics.”

Full data for #Covid19uk during UK lockdown

This blog provides access to data on tweets using the #Covid19UK hashtag during the UK lockdown, the first day of which began on 24 March 2020. The data were extracted using TAGS, and then mapped using NodeXL. There were of course other UK-focused hashtags used during this period and some UK-based Covid-19 tweeting that did not use any hashtag. However it was unfeasible to capture all the data. I therefore stuck with one hashtag all the way through. You can see further information, including other search terms and ways of presenting data, in a tweet thread. These data are updated on a weekly basis (except where there is too much data to plot at once, in which case they are charted by day). There’s more about this work on the BMJ Opinion blog.

Details are provided below, but you may want to start with the summary outputs by month between March/ April and December. These summarise the top tweets (by number of retweets received) until end of July 2020, before moving to a different approach from August 2020 onwards where I attempt to capture more diversity in tweeters by making sure that no tweeter has more than 3 tweets in the summaries. Click to go to the Wakelet summary. Note that some tweets may have subsequently been deleted by Twitter or the tweeter, and some users will have left Twitter or been suspended. Accordingly, I have included PDF summaries that capture a permanent record. Links to the PDF summaries are included in the Wakelet summaries for each month:

From March 2022 I have not been producing Wakelet summaries, but the full data are available in NodeXL maps (data at end of each NodeXL report):

I aim to combine outputs from this period into a summary Wakelet when time.

Continue reading “Full data for #Covid19uk during UK lockdown”

A review of the BMJ’s social media content during the covid-19 pandemic

Another post in an occasional series of articles and papers that were not published in peer reviewed papers or journal blogs.

This blog explores a sample of healthcare-focused tweets across the period of the UK lockdown. With the huge number of tweets posted and retweeted during the pandemic, and the wide range of different hashtags, it was necessary to narrow my search down to look at a single account. I therefore explored the exchange of information between the BMJ (@bmj_latest) and its readers via social media. While most social media searches are limited to a period of 7-10 days into the past, Twitter allows longer-range searches for a single account (up to 3,200 tweets and retweets).

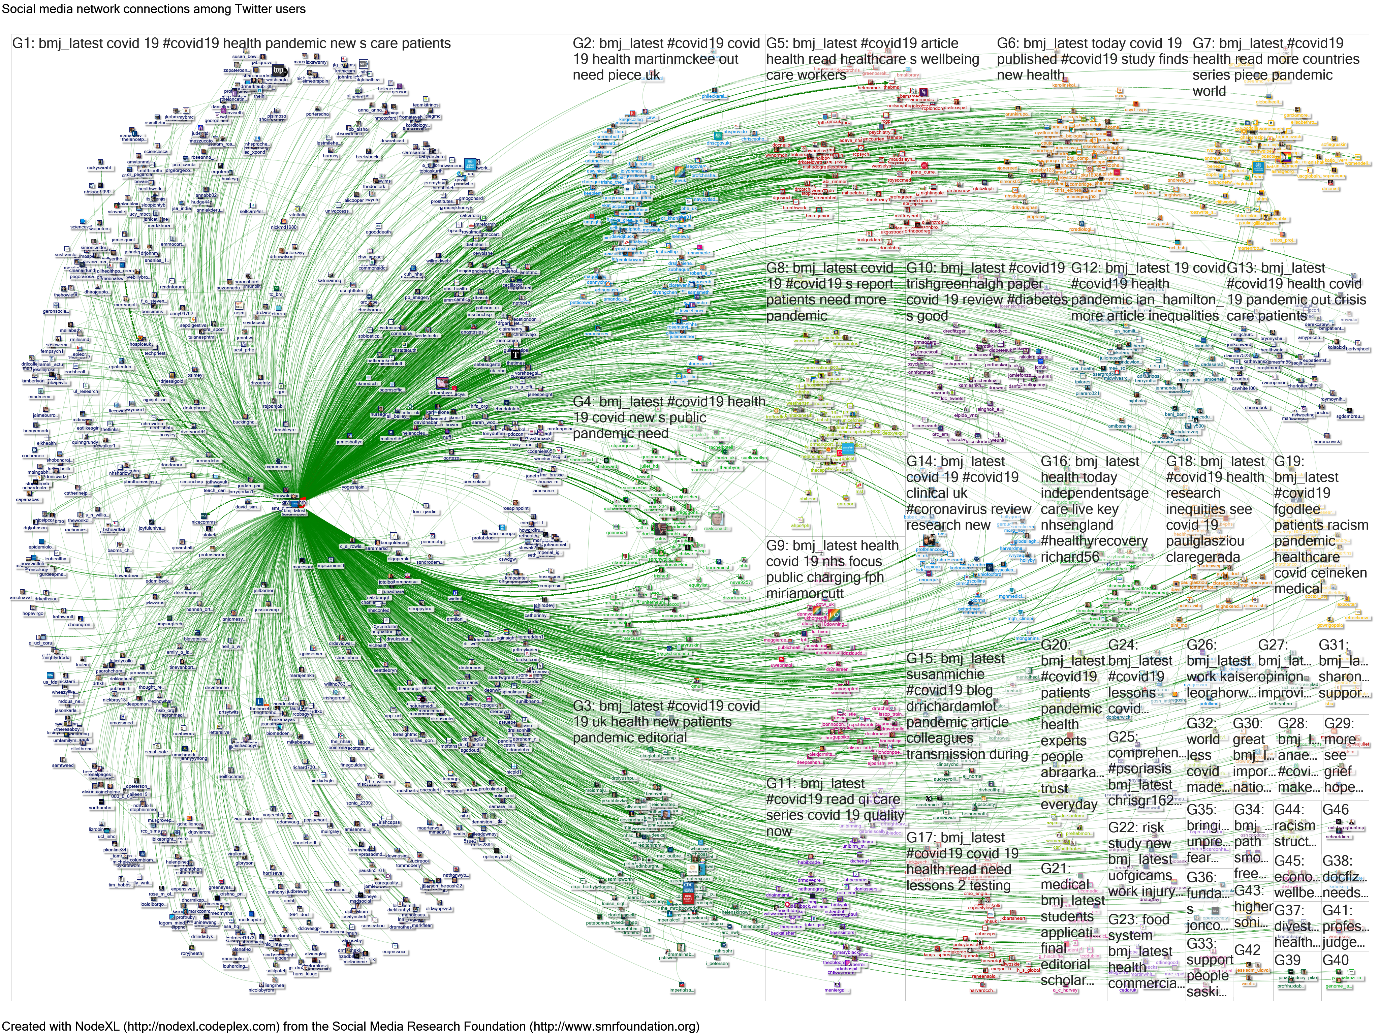
On 20 June I used NodeXL to map several international medical journals (BMJ, BJSM, Lancet, NEJM, JAMA and Nature Medicine) to gain an overview of their tweeting patterns. There was considerable variation in the number of tweets posted and the level of engagement between the different journals and readers. More detail is provided in a Wakelet summary. The BMJ was the most engaged, posting and retweeting much more regularly than any of the other journals studied. The covid-19 lockdown started on 23 March 2020 in the UK. Fortuitously, the NodeXL extract for @bmj_latest extended back to 6 March 2020. The single user search gives a map focused on that user without showing the interactions between other users (Figure 1). We need an additional step to transform the data.

Figure 1. The user list for @BMJ_Latest (16 March to 20 June 2020). Source NodeXL.
Figure 1. The user list for @BMJ_Latest (6 March to 20 June 2020). Source NodeXL.

Another quirk of Twitter data extraction allows us to extract original tweets back as far as we like, as long as we have the unique tweet ID. This is the number at the end of a tweet URL – e.g. for this BMJ tweet it is 1236199998192312320. I extracted the tweet and retweet IDs from the map in Figure 1 and imported the original tweets into a conventional social network map. This step identifies the original tweets that the BMJ retweeted, showing us connections between tweeters (Figure 2). NodeXL also groups tweeters into communities according to tweeting patterns.

Figure 2. The @BMJ_Latest network reconstructed from tweet and retweet IDs (16 March to 20 June 2020). Source NodeXL.
Figure 2. The @BMJ_Latest network reconstructed from tweet and retweet IDs (6 March to 20 June 2020). Source NodeXL.

Figure 2 shows different types of connections – for example if mentioned in a tweet, if replied to or replying to a tweet, or if retweeting a post. This map demonstrates that the BMJ interacts broadly with its readers. Of the 3,196 tweets successfully extracted, 1,996 tweets were posted by the BMJ, mentioning 685 tweeters. The remaining 1,200 tweets (38%), each retweeted by the BMJ, were posted by 665 tweeters.

Covid-19 and associated terms were the most used hashtags (Figure 3). The Wakelet summary lists the top tweets posted or retweeted by the BMJ in chronological order. Each tweet included in this summary received at least 100 retweets. These can be considered “viral tweets”: despite over 400,000 followers, on average the BMJ receives a median of 16 retweets per tweet. Examples of covid-19 coverage included face-to-face and remote assessment in primary care, health inequalities, moral injury and PPE shortages in healthcare workers, face covering, prediction models, risks for black and minority ethnic populations,  lessons in loosening lockdown, mental health, schools reopening, concerns about poor quality research and lack of trust in government. The top tweets were not just about covid-19. Tackling racism in healthcare was discussed before lockdown started. Gabapentinoids in managing pain were the subject of a popular infographic. The impact of trade agreements on the NHS was also covered. The breadth of coverage in BMJ tweets and retweets – both for covid-19 and more generally – is impressive and reflects the healthcare and public health focus of the journal and readership.

Figure 3. Hashtags used in the tweets posted and retweeted by @bmj_latest 6 March to 20 June 2020.

This blog demonstrates the use of the “popularity” of a tweet to help sift through a lot of social media data. Applying this approach to the BMJ’s tweets during the pandemic has illustrated the breadth of the journal’s content and has helped identify the “viral content” posted and shared by the journal. Social media is a two-way process. The 120 tweets listed in the Wakelet summary were shared widely – 4% of tweets posted by 1.6% of tweeters in Figure 2 received 30% of all retweets. We can start to understand the most engaging content through the eyes of the journal’s readers and social media followers. This is useful information, but would have been missed had this analysis been attempted just a few days later. Just as the paper journal gets recycled, and tweets move as if by gravity towards the bottom of our screens, social media data is only available transiently. Blink and you miss it. Retrospective data collection becomes very expensive. Healthcare organisations, individual healthcare workers and journals need to adapt to understand a world where social media is integral to learning. Covid-19 accelerates this process.

Dr Graham Mackenzie, GPST2, Edinburgh, Scotland

7 August 2020.

graham mackenzie on twitter

How COVID-19 has changed infectious diseases communication on social media: Through the lens of @TheLancetInfDis

This is another post in an occasional series of social media analysis that didn’t reach the pages of peer reviewed journals. It was completed on 28 June 2020, rejected by Lancet Infectious Diseases on 16 July 2020.

Article, very slightly modified, follows…

So much has changed in such a short time. It is difficult to stand back and take a long view. In this article I explore the way that infectious diseases messages have been shared via social media over a period of over two years (11 April 2018 to 18 June 2020), including the pandemic. The detail is provided in two Wakelet summaries – one for tweets by the Journal, the other for retweets by the Journal. Briefly, I used a quirk of Twitter analysis that allows data extracts over a longer period than normal by looking at a single account (@TheLancetInfDis). The original NodeXL extract provided data centred on the Journal’s Twitter account. I remapped this to chart wider connections and updated the data a week later. This approach provided up-to-date information on 1,356 tweets by @TheLancetInfDis account and 1,840 tweets by 371 other accounts which the journal retweeted.

thelancetinfdis - user map via NodeXL
thelancetinfdis – user map via NodeXL

thelancetinfdis - network map after extracting details of other tweeters
thelancetinfdis – network map after extracting details of other tweeters

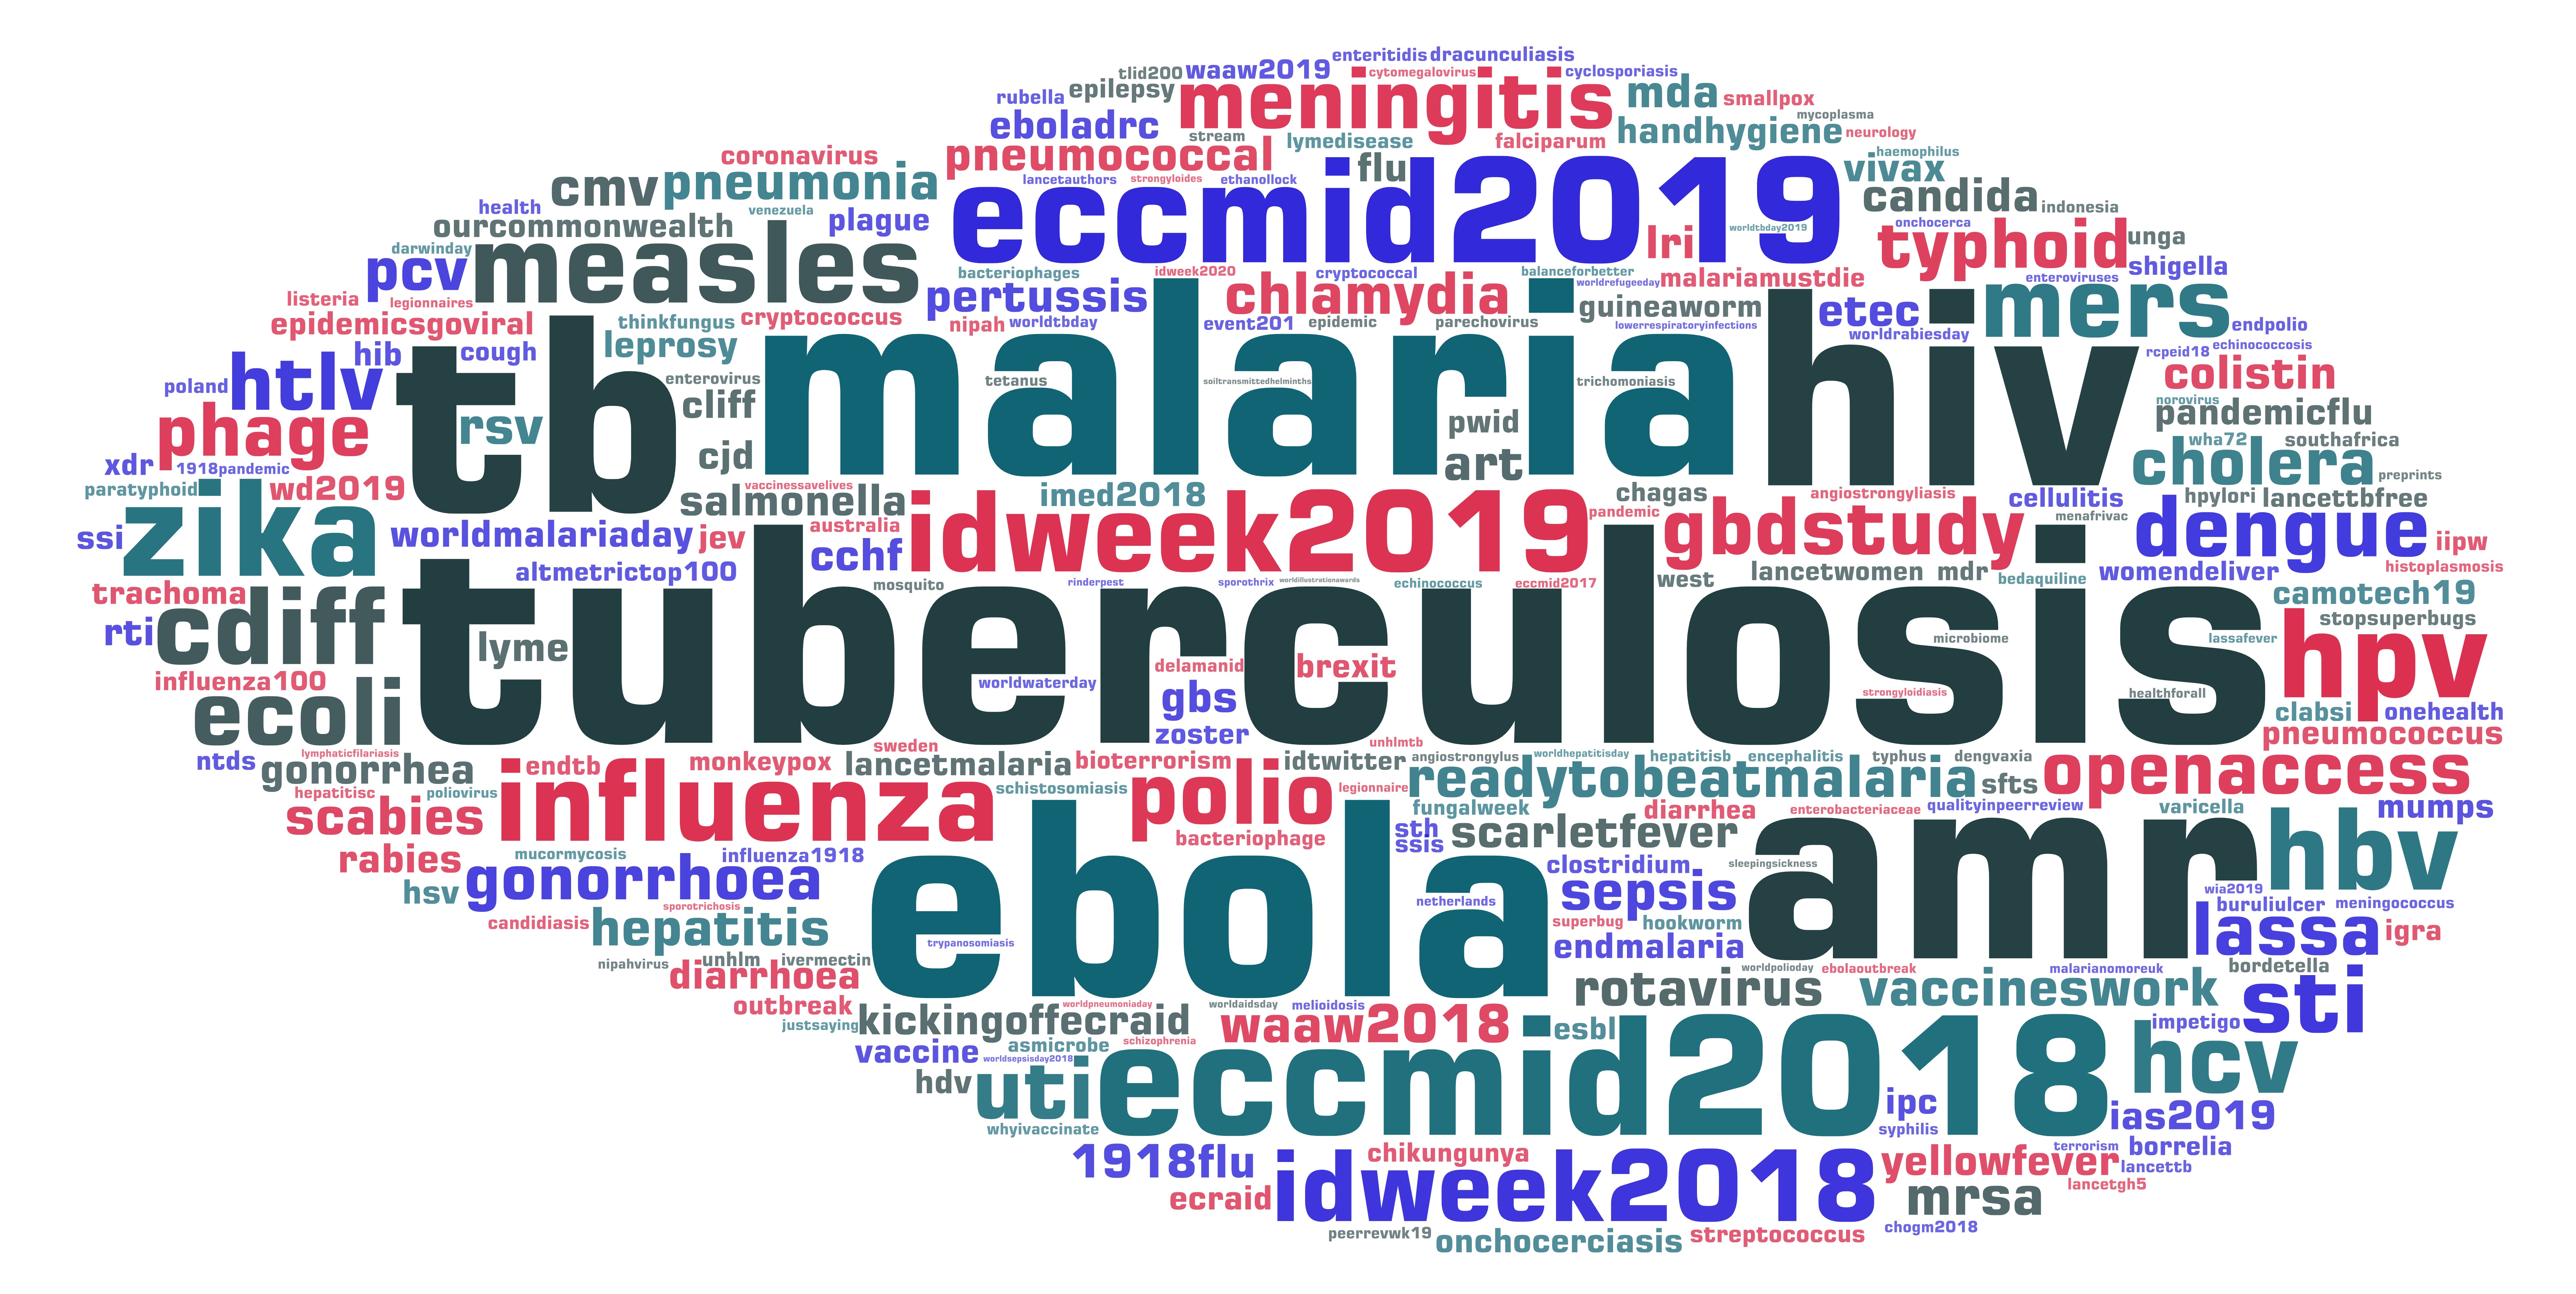
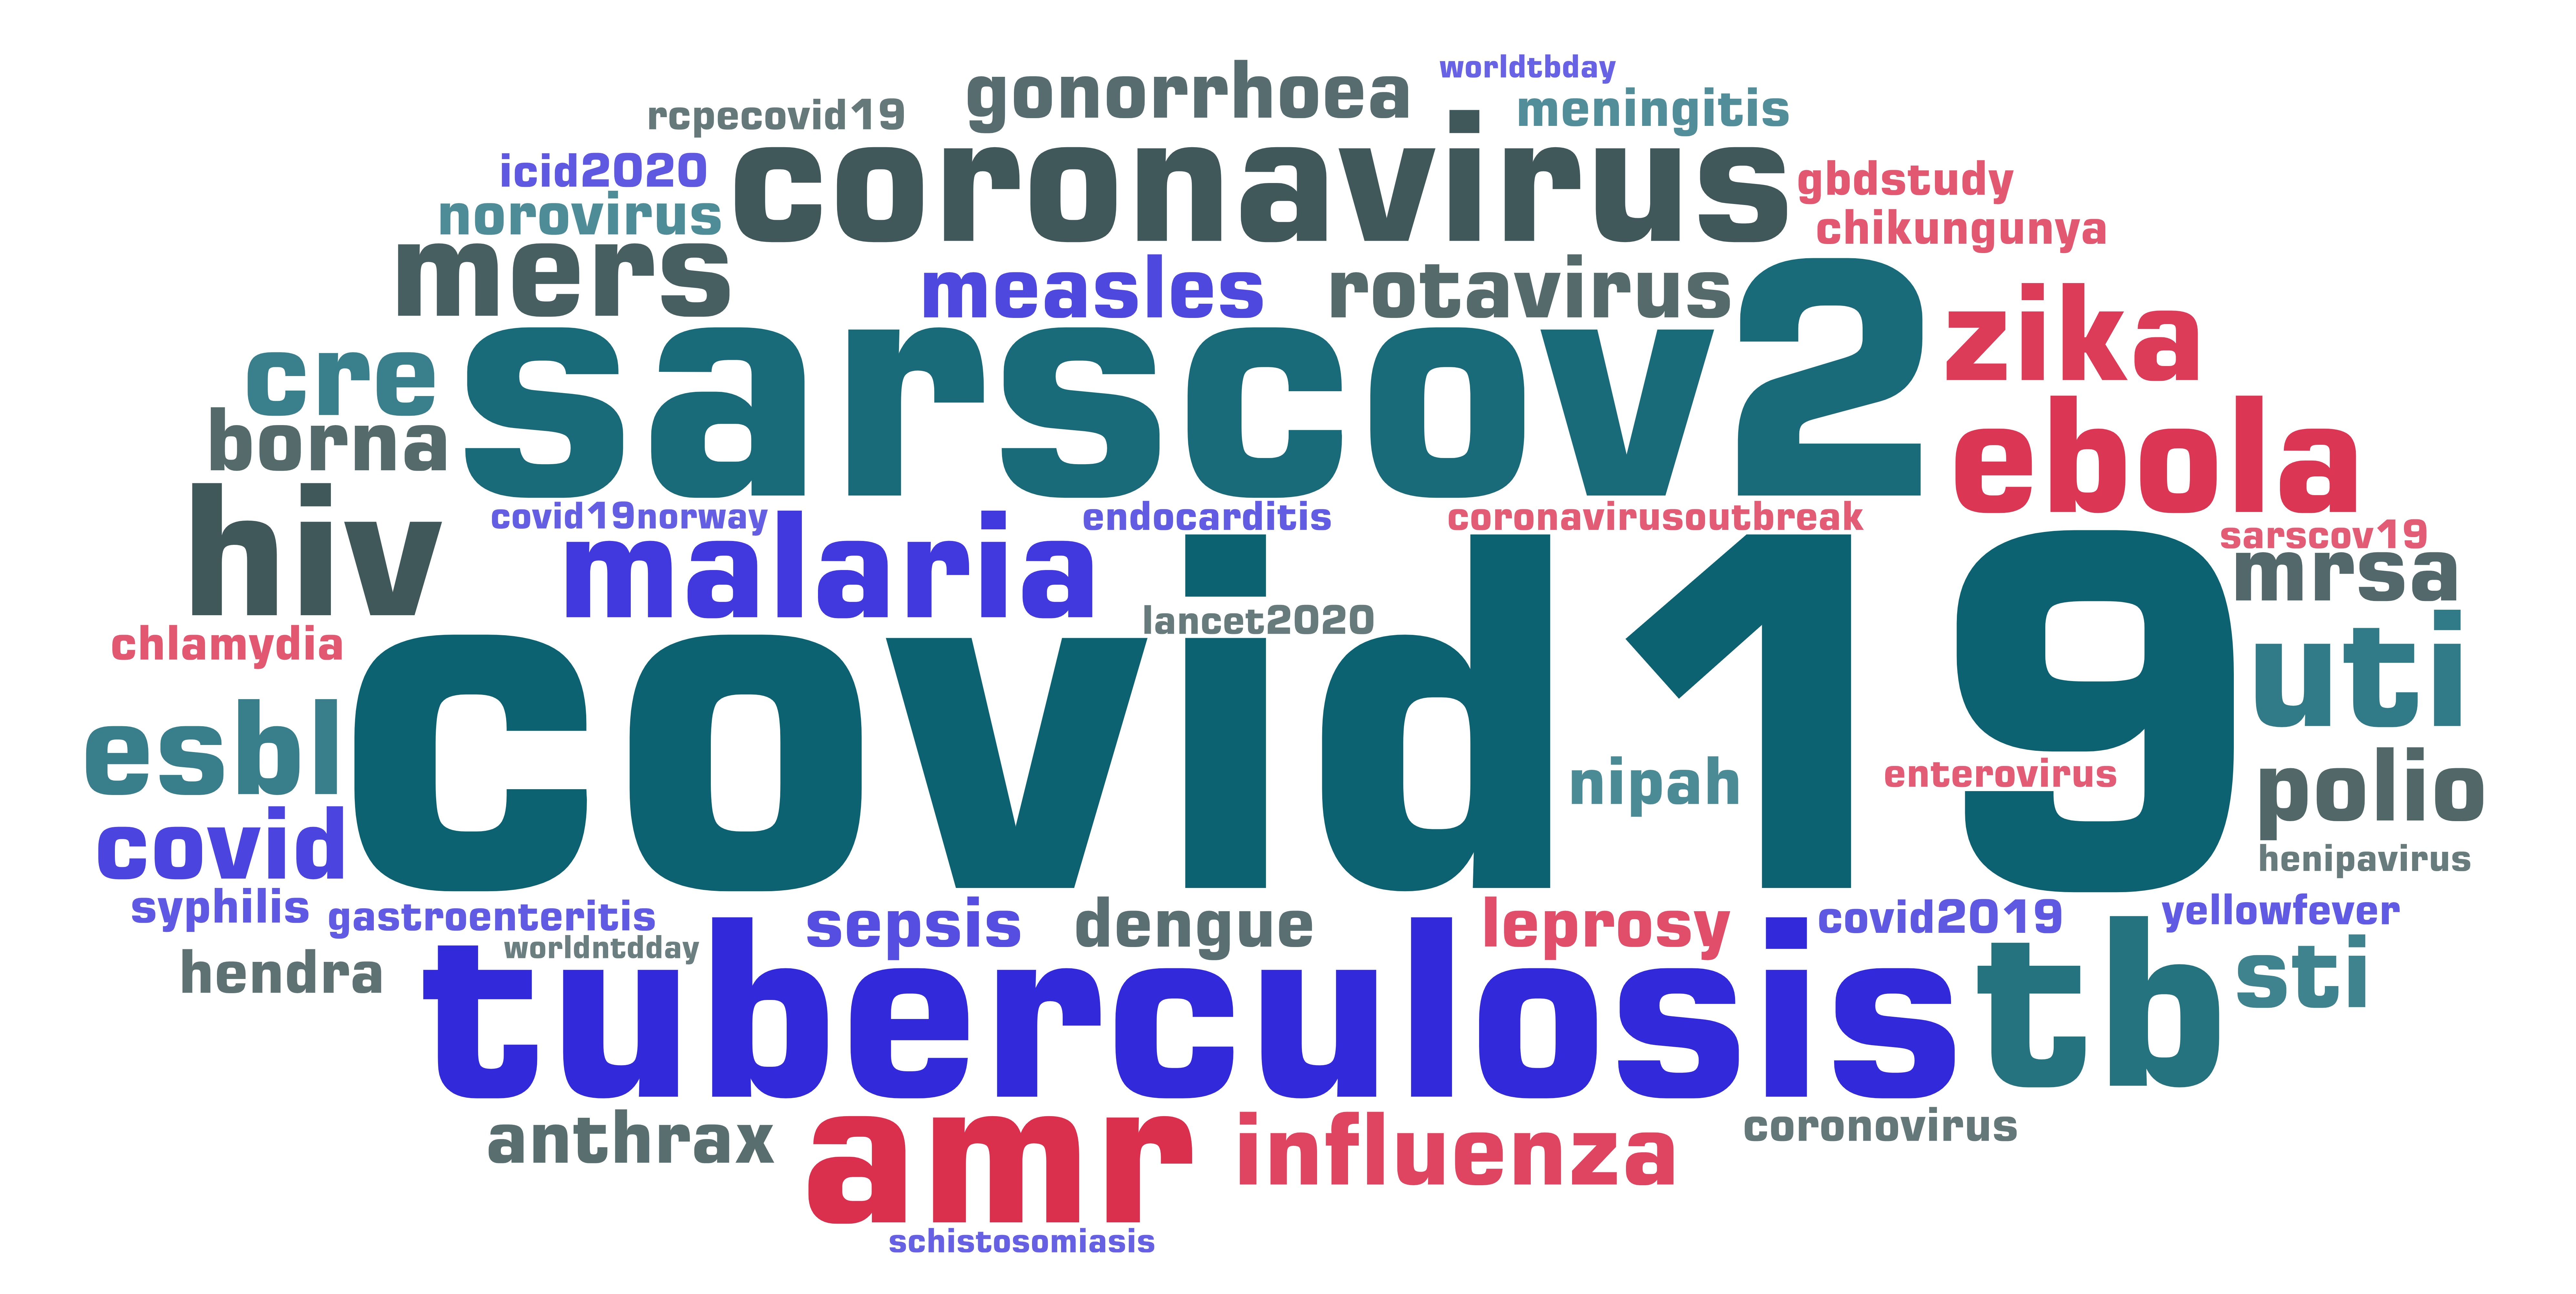
Prior to the pandemic the Journal covered a wide range of topics: an “angiostrongyliasis to zoster” of infectious disease, with TB, malaria, HIV, antimicrobial resistance and vaccination popular topics. Since January 2020 there has been a stark narrowing of topics, with COVID-19 related terms dominating: though the Journal continued to tweet about topics from anthrax to zika, two thirds of the hashtags used were COVID-19 related. Interactive word clouds provide detail and allow exploration of the individual tweets (you can access these by clicking on the images below, or fuller information in the Wakelet summary of tweets).

Hashtags in @TheLancetInfDis tweets prior to the pandemic - by number of tweets posted Hashtags in @TheLancetInfDis tweets prior to the pandemic - by number of tweets posted
Hashtags in @TheLancetInfDis tweets prior to the pandemic – by number of tweets posted Hashtags in @TheLancetInfDis tweets prior to the pandemic – by number of tweets posted

Hashtags in @TheLancetInfDis tweets during the pandemic - by number of tweets posted Hashtags in @TheLancetInfDis tweets during the pandemic - by number of tweets posted
Hashtags in @TheLancetInfDis tweets during the pandemic – by number of tweets posted Hashtags in @TheLancetInfDis tweets during the pandemic – by number of tweets posted

There has simultaneously been a step change in the reception of the Journal’s tweets, peaking in March. During the pandemic, tweets by the Journal received twice as many retweets as before and the content retweeted by the Journal reached a much wider audience (though that will be influenced by a range of factors as some of these retweeted posts were already “going viral”).

Number of tweets made and retweets received by @thelancetinfdis

For the full 26-month period 42/100 of the Journal’s top tweets and 83/100 of the top retweeted posts were about COVID-19. It is not possible from these data to separate out whether these tweets – by the Journal or other tweeters – were shared by the general public or individuals and organisations with a specialist interest in infectious disease. Nonetheless, the individual tweets posted and retweeted provide an international view of the pandemic including research, ethics, public health, clinical, epidemiological, pharmacological, political and social dimensions.

Many of the lessons from COVID-19 are transferable to other infectious diseases. Hopefully the awareness, interest and connections generated during the pandemic can be converted into wider knowledge of infectious diseases among professionals and public after the pandemic.

Dr Graham Mackenzie, GPST2, Edinburgh, Scotland

16 July 2020.

graham mackenzie on twitter

Taking a long-view of tweeting – an example looking at @HelenBevan’s account

Introduction: A few days ago I contacted Helen Bevan to share a social network map of her tweets over a period of almost 2 years. Helen has been a great source of support over the past 5+ years after we met in social media discussions about quality improvement and then in person with the Q Community.

I had run this most recent map of Helen’s tweets as an experiment to look at long range tweeting. Usually it is only possible to look at a few days of tweets. However Twitter allows you to extract tweets over a longer period if looking at a single account, providing access to up to 3,200 tweets and retweets. Helen is well known as one of the UK’s top healthcare tweeters. She is also very supportive of colleagues from across the world, reading and commenting on others’ tweets and blogs and is quick to share useful content with her 86,000+ followers. Mapping her social network connections would help her understand her audience and the content that had most impact. Helen tweeted my map. The map intrigued and confused some of Helen’s followers, so I have posted a blog on this analysis. (The blog is also available as a PDF file; there is also a PDF version of the associated Wakelet summary).

Continue reading “Taking a long-view of tweeting – an example looking at @HelenBevan’s account”

Finding the sweet spot in healthcare social media communication: A call for greater clarity in medical and science hashtags

Scientific communication relies on clarity, specificity and universality. In this blog I explain how communication between medical tweeters is held back by a lack of clarity in hashtag choice, and by the absence of a “fuzzy search” feature in Twitter. I explore lessons from the way that medical research papers are categorised (MeSH headings) and propose options for improving medical tweeting, helping people to look beyond their usual social media bubble.  I also demonstrate ways to visualise intentions vs reception for hashtags in two topical issues using word clouds.

I have written this as a blog, because I wanted to include a more reflective exploration of this topic than I could in a traditional medical paper. Hopefully, with the contribution of other medical tweeters, the ideas presented here can be developed into a peer reviewed paper in a medical journal.

Continue reading “Finding the sweet spot in healthcare social media communication: A call for greater clarity in medical and science hashtags”

Health innovation and COVID-19 pandemic: Defining the need and understanding the response.

Health innovation and COVID-19 pandemic: Defining the need and response.

A question heard on the wards recently – how can we capture all the innovations that have emerged from the COVID-19 pandemic? I’m sure that there are similar questions in hospitals, GP surgeries and other organisations across the world.
In order to answer this question we need to start by defining innovation. The World Health Organization (which might want to drop the American spelling in light of recent political decisions) defines health innovation as follows:

“Health innovation is to develop new or improved health policies, systems, products and technologies, and services and delivery methods that improve people’s health, with a special focus on the needs of vulnerable populations.

  • WHO engages in health innovation in the context of universal health coverage
  • Health innovation adds value in the form of improved efficiency, effectiveness, quality, safety and/or affordability
  • Health innovation can be in preventive, promotive, therapeutic, rehabilitative and/or assistive care”

In classic Public Health style WHO identifies 3 overlapping domains necessary to capture health innovation fully – science innovation (R&D), social innovation, and business innovation – each of which we can see in evidence in the wider pandemic response.

This is a useful definition for a number of reasons:

Continue reading “Health innovation and COVID-19 pandemic: Defining the need and understanding the response.”