Guest editing WePublicHealth global public health Twitter feed (28 May to 4 June)

Between 28 May and 4 June 2017 I guest edited the Twitter feed for the second time. Read blog from guest editing this global Public Health blog the first time (January 2016).

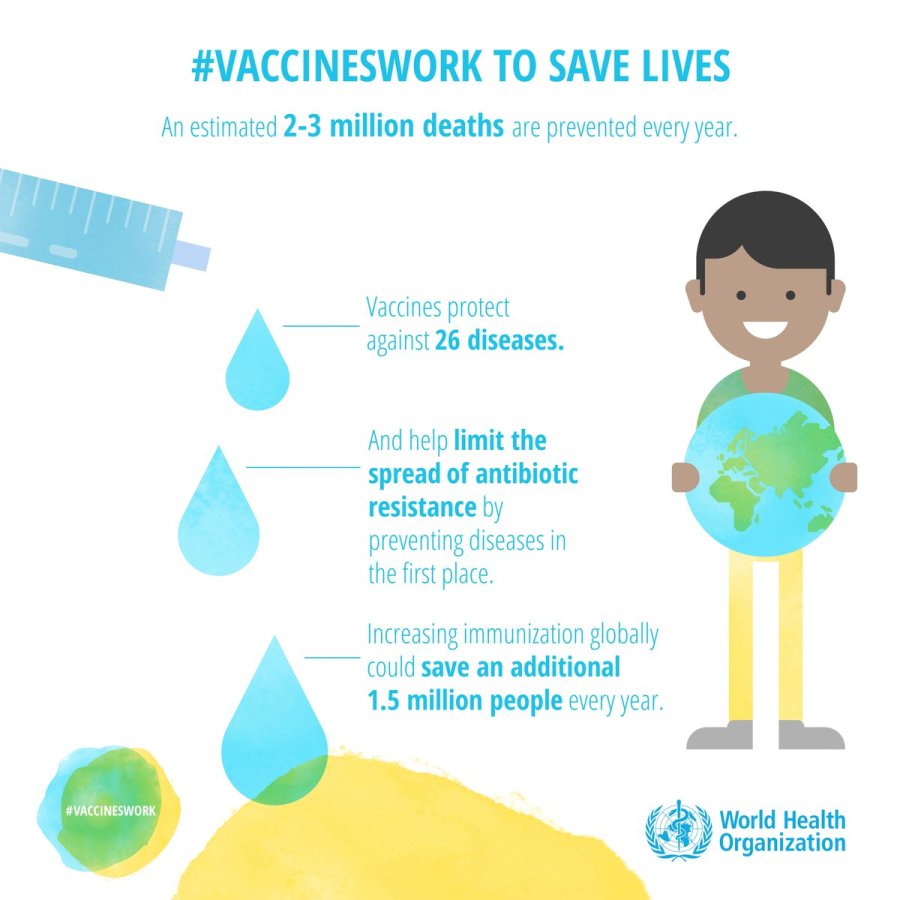
This time round I used Twitter “big data” to source the best tweets and related materials from around the world on a series of Public Health topics, including physical activity, social determinants of health, antibiotic resistance, vaccination, smoking, mental health, and advocacy, introducing a new topic each day. I took the “big data” outputs and produced simple summaries on each topic. Find out more about the techniques I used in this blog on Immunization Week last month.

On 31 May I tweeted live from the Royal College of Physicians Edinburgh conference “Public Health in a Changing World” (hashtag , programme here).

Read a short summary of each day’s activities below. From grassroots advocacy to global awareness campaigns this provides a whirlwind tour of recent Public Health work across the world.

Graham Mackenzie (@gmacscotland on Twitter)

Consultant in Public Health

4 June 2017

Cynergy_Graham MacKenzie_509 (1)

(Photo taken from Inverleith Park, north Edinburgh, looking south over pond to Edinburgh Castle and Arthur’s Seat, evening of 2 June 2017)

Continue reading “Guest editing WePublicHealth global public health Twitter feed (28 May to 4 June)”

Using Twitter big data to study global Public Health campaigns (Immunization Week: #VaccinesWork)

It is almost 50 years ago since “Our World”, the first live international satellite TV broadcast, most famous for the first performance of The Beatles’ “All You Need Is Love” (25 June 1967). The show reached an audience of 400-700 million. The most famous band on earth beamed out to living rooms across the world. This was an impressive achievement, but the information flowed just one way. The digital revolution was yet to happen.

Between 24 and 30 April this year Immunization Week tweets using the #VaccinesWork hashtag passed across devices almost 1.5 billion times(1). Information flowed in both directions – international and national health organisations promoting vaccination, and individuals responding and sharing information of their own. The overall impression of Immunization Week is an extremely well planned and organised multi-agency international campaign, with plenty of evidence-based tweets using images and links to informative webpages. There were tweets by national organisations that provided country specific information. There was also a considerable amount of high quality and informative tweeting at individual level, by clinicians, parents and many others, though these posts risked being overwhelmed by tweets from international organisations in the “big data” analysis.  While there was some negative tweeting by anti-vaccination campaigners, some of them with considerable reach on social media, the balance overall was firmly in favour of vaccination.

This blog summarises the main findings of the big data analysis, pulls out some detail (eg top tweets and resources, the type of influence exerted by top tweeters), and describes the methodology (basic and advanced) so that others can repeat this type of analysis on other global health campaigns. The big data techniques include NodeXL maps, similar in appearance to the spread of communicable diseases (figure 1), except in social media analysis spread is usually seen as a positive. I have used two Public Health evaluation frameworks to summarise main findings (Donabedian’s Structure, Process and Outcome; and RE-AIM).

Herd Immunity
Figure 1. Explaining herd immunity in 6 seconds via IFL Science

Continue reading “Using Twitter big data to study global Public Health campaigns (Immunization Week: #VaccinesWork)”

Quality2017: watching in via Twitter

I can’t think of a better starting point for learning about quality improvement than the International Forum on Quality and Safety in Healthcare. Run by Institute for Healthcare Improvement (IHI) in Boston and the BMJ this huge quality improvement Forum attracts interest and expertise from across the world, with something for everybody, from beginner to quality improvement champion.

This year the Forum ran from Wednesday 26 to Friday 28 April in London. The Wednesday was an “experience day” – the Forum itself was on Thursday and Friday, with the theme ‘Ingniting Collective Excellence’. To quote from the Forum website: “We focus on how the power of collaboration can inspire all parties, including patients, families, new healthcare professionals and improvement leaders to deliver top quality, person-centred care in a sustainable framework.” This was an ambitious theme that anybody working in, or cared for by healthcare systems across the world, could get behind.

I have attended two Forums – Paris 2008 and Gothenburg 2016. A novice in Paris (presenting research rather than quality improvement), I was pleased to present quality improvement work on supporting low income families in Leith, Scotland at the Gothenburg Forum, which coincided with publication of that work in BMJ Quality Improvement Reports.

This year I wasn’t able to attend the Forum, but took some time to watch the tweets, retweet some of these tweets, post some ideas of my own, and run a “big data” analysis of the Forum tweets (identified using #Quality2017 hashtag) using NodeXL. See previous blog post and BJSM editorial for more on the methodology used here.

Colleagues interested in quality improvement have been early adopters of social media – almost evangelical in their promotion of Twitter for learning, networking and broadcasting. It is no surprise, therefore, that there are rich pickings from the tweet from the Forum. See Gill Phillip’s summary, capturing a flavour of the tweets. The snapshot presented in this blog is presented purely as an illustration of the potential (and limitations?) of big data.

Also check out the top 40 tweets in this Wakelet summary.

Continue reading “Quality2017: watching in via Twitter”