
What can we learn from a conference even when we’re not there, using Twitter and some big data analysis? I beamed into the European Public Health conference in Vienna, 9-12 November, to find out…
Throughout 2016 #ScotPublicHealth has looked at using social media for three main purposes: learning, broadcasting and networking for Public Health. We have learnt how to use Twitter more effectively, produce infographics and summarise social media activity in “Storify” stories as just a few examples. An effective tweet, we have learnt, should include an image, ideally a URL (eg to a blog, paper, film, presentation), a hashtag, and mention of a source or influencer in that topic (eg the journal, author or organisation you’re referencing in the tweet; and/or somebody who you think may be interested in the tweet). These ingredients of a good tweet draw the eye in (picture), inform (picture and URL), and increase the chance that others will see the tweet (hashtags help organise tweets and help with searching; the person/ organisation mentioned may like and/or share the tweet with their followers). These points are summarised neatly in the following image: BLONDE.

Source: Theresa Porrett (via Academy of Fab (NHS) Stuff)
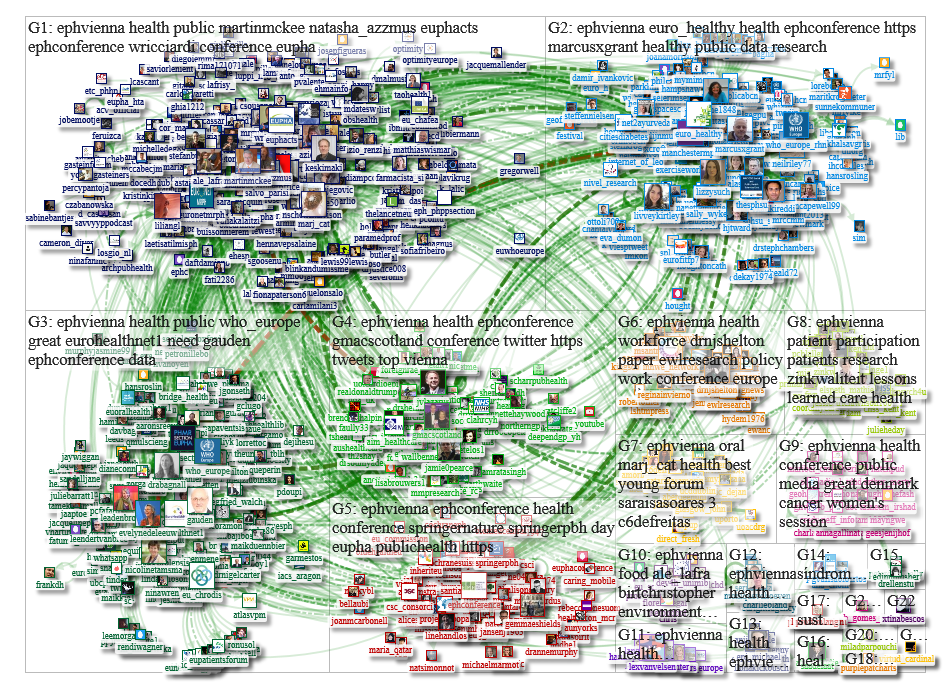
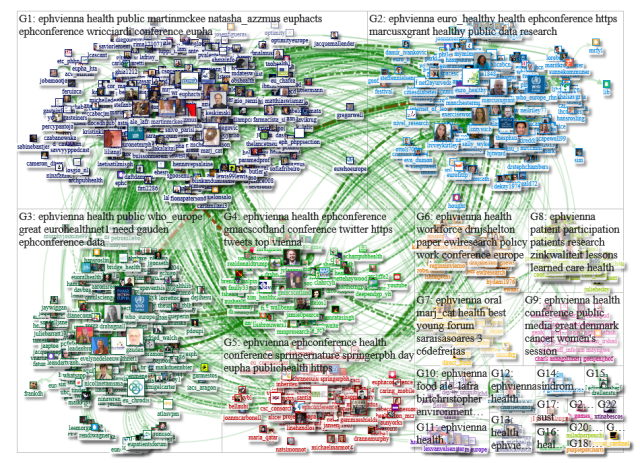
Moving beyond these Twitter basics, this blog introduces a technique (social network analysis (SNA) using NodeXL) to process and interpret large volumes of tweets. While SNA maps look at networks, and interactions between tweeters, the focus of this analysis is on learning: using the top hashtags, words, word pairs and URLs identified during the analysis to identify the main topics emerging from a conference, the chief influencers, and the messages that connect with the audience. This blog will not cover the very technical aspects of NodeXL – that has been covered elsewhere (eg in this comprehensive write up by Pew Research Center). Instead it pulls out key points and learning from the analysis. The search terms that I used and more details are provided in the links for the individual SNA maps below.

Hundertwasserhaus, Vienna (Wikipedia)
I used the technique to watch the tweets from the European Public Health Conference, 9-12 November, Vienna. I checked in to read tweets a couple of times a day throughout the conference (searching for #EPHVienna in Twitter), retweeting posts that I found interesting/ useful. I extracted information about each individual day and the conference overall using the NodeXL Excel add on, again searching for conference hashtag #EPHVienna. I uploaded the NodeXL analysis onto the NodeXLGallery website and tweeted the results each day (this required a number of attempts while I learnt the idiosyncracies of the Twitter universe, with help from Marc Smith of the Social Media Research Foundation, Belmont, California). I extracted information from the conference using the FollowTheHashtag website and tweeted these findings too (on subsequent examination this only gave an incomplete record of the volume of tweets so I have not shared the results here). It would have been great if the conference had set up a Symplur healthhashtags site too, for an accessible and complete record, but that is something to consider for next year’s conference.
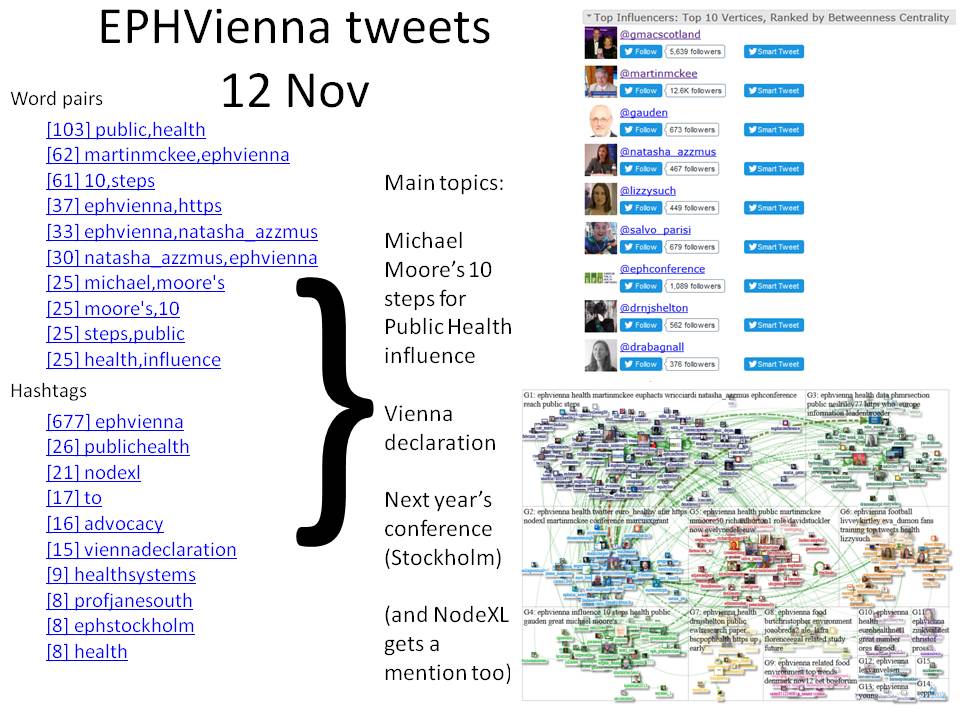
The results are shown in the appendix, day by day, to capture the different themes of the preconference (9 Nov) and conference proper (10-12 Nov). Full information provided by NodeXL is available at the individual links in the appendix. I have extracted “word pairs” in tweets, hashtags, and top influencers. Full extracts of the data are also provided at the end of each NodeXL graph gallery page.
As a high level analysis, hashtag count by day provides a useful summary of the number of tweets and retweets using that term (I have excluded generic hashtags such as #EPHVienna, #PublicHealth and #Health). The main themes of the preconference sessions on 9 November, and the plenary session on 10-12 November are clearly identified. These terms also appeared in the “word pairs” listed for the full conference period. With further tweets and retweets on subsequent days of the conference the final number of tweets for individual tweets increased over time.

Abbreviations in graph: HIS = health information systems; TB = tuberculosis; “TO-REACH” (actually #TO as Twitter does not include hyphens in hashtags) is a programme “transferring and implementing good models of care“, presented by Prof Ricciardi (@WRicciardi); HIAP = health in all policies; Periscope is a way to live stream information at a conference.
The main influencers at the conference included the conference Twitter account, organisations, presenters and individuals. Most were at the conference, but I ended up as one of the top influencers through a combination of retweeting conference tweets and posting a few tweets with results of the NodeXL analysis. I captured these tweets and retweets in a Storify summary (first manual attempt), and have refined the methodology to produce a second summary.
Looking at the conference tweets in general (including many of the retweeted posts in the Storify summary), it is clear that many do not follow the BLONDE principles listed above: grainy images of distant slides, inconsistent use of hashtags, sporadic use of URLs to papers/ reports/ videos/ other resources. Conferences are an excellent opportunity to share work – through physical and virtual means, and sharing URLs to work is an important tool for dissemination. Fleming reflected on the importance of good communication and dissemination of findings in 1947:

Alexander Fleming reflecting on the importance of disseminating findings at conferences.
Conference organisers, and delegates, would increase the social media impact of the conference if they used high quality images (eg of plenary and breakout presentations, which could be made available in advance on the conference website), and if they sourced URLs and agreed on hashtags and top influencers on a topic.
Discussion and summary
Twitter is the dominant social media platform at academic conferences, providing opportunities for learning, networking and broadcasting information. This exploration has shown that it is possible to achieve all three even if you’re not at the conference. NodeXL provides a way to extract a lot of information rapidly (big data), and share key points during the conference. Through this exercise I have identified Public Health colleagues with shared interests from across Europe and the rest of the world; have identified new references and resources in my own field and of more general interest to Public Health; and have shared key learning points from the conference with a wider audience, as well as introducing a new audience to social network analysis. This analysis has also identified ways for conference organisers and delegates to improve the impact of their tweeting for future conferences (register conference hashtag with Symplur; make high quality images available in advance; come armed with URLs to your work). I will use the techniques learned for this analysis to summarise further conferences from a distance, plus impact of Public Health social media activities (eg #AntibioticAwarenessWeek).
Graham Mackenzie (@gmacscotland on Twitter)
Consultant in Public Health
28 November 2016

Appendix – summary of results
Top URLs in Tweet in Entire Graph (9-12 Nov):
[17] My Storify summary of conference tweets

[8] WHO Regional Office for Europe The European health statistics app

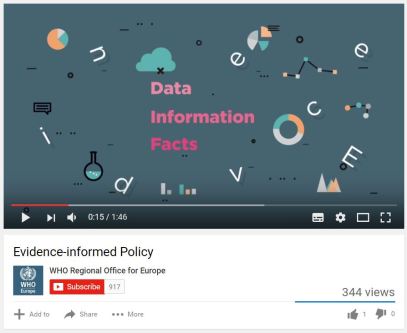
[7] WHO Regional Office for Europe Evidence-informed Policy (short film)


Word pairs [number of tweets + retweets] 9-12 Nov: click link to see tweets from that period
[314] public,health
[87] martinmckee,ephvienna
[87] ephconference,ephvienna
[87] euro_healthy,ephvienna
[71] ottawa,charter
[69] natasha_azzmus,ephvienna
[67] health,promotion
[61] 10,steps
[61] ephvienna,natasha_azzmus
Hashtags [number of tweets + retweets] 9-12 Nov: click link to see tweets from that period
[2433] ephvienna
[123] publichealth
[41] health
[38] eupha
[33] healthpromotion
[30] hiap
[30] nodexl
[26] ottawacharter
[24] viennadeclaration
[24] his
The top influencers, ranked by betweenness centrality (the node – or tweeter’s – centrality in a network) are shown below for 9-12 November.

Prior to conference, including pre-conference session on 9 Nov

Day 1 of conference proper (10 Nov)


After the conference (13 to 20 Nov)
Technical points and acknowledgements
NodeXL analysis can look back at tweets for up to the past 9 days, extracting key information about individual tweets using a word, hashtag (eg #EPHVienna) or twitter handle (eg @ScotPublic). Search terms can be used to refine the period extracted (eg to a single day using GMT). There are limits to the number of tweets that can be extracted (max 18,000). Such analysis is demanding of computer processing, ideally 16-32Gb RAM, and preferably a modern version of Excel on a 64 bit system. Most of the analysis described here was performed on an older system with Excel 2007, which required a number of workarounds).
The main social media influencers at a conference can be counted in various ways:
- by number of tweets
- number of mentions and replies (which is a measure of engagement and interaction)
- number of impressions (times tweets pass across a device such as phone, tablet or PCs (which is a measure both of the interest in the tweet and the number of followers)
- number of retweets and likes (which are also measures of the level of interest in the tweet, but less affected by the number of followers)
- and by “betweenness centrality”, which is a measure of connections.
I would like to thank Mark Outhwaite for introducing me to NodeXL and Marc Smith and his colleague Arber in Albania for their support setting things up on my rather basic computer.

Pingback: Quality2017: watching in via Twitter – #ScotPublicHealth
Pingback: Using Twitter big data to study global Public Health campaigns (Immunization Week: #VaccinesWork) – #ScotPublicHealth
Pingback: Guest editing WePublicHealth global public health Twitter feed (28 May to 3 June) – #ScotPublicHealth
Pingback: Increasing the quality and impact of Public Health tweeting – looking beyond #ScotPublicHealth – #ScotPublicHealth
Pingback: Social network analysis: quirks, pitfalls and biases – #ScotPublicHealth
Pingback: How to run social media for a health conference: planning, tweeting and summarising – #ScotPublicHealth