Another post in an occasional series of articles and papers that were not published in peer reviewed papers or journal blogs.
This blog explores a sample of healthcare-focused tweets across the period of the UK lockdown. With the huge number of tweets posted and retweeted during the pandemic, and the wide range of different hashtags, it was necessary to narrow my search down to look at a single account. I therefore explored the exchange of information between the BMJ (@bmj_latest) and its readers via social media. While most social media searches are limited to a period of 7-10 days into the past, Twitter allows longer-range searches for a single account (up to 3,200 tweets and retweets).
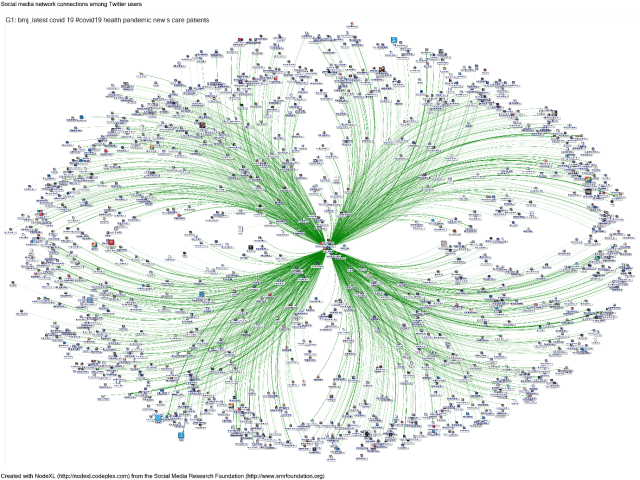
On 20 June I used NodeXL to map several international medical journals (BMJ, BJSM, Lancet, NEJM, JAMA and Nature Medicine) to gain an overview of their tweeting patterns. There was considerable variation in the number of tweets posted and the level of engagement between the different journals and readers. More detail is provided in a Wakelet summary. The BMJ was the most engaged, posting and retweeting much more regularly than any of the other journals studied. The covid-19 lockdown started on 23 March 2020 in the UK. Fortuitously, the NodeXL extract for @bmj_latest extended back to 6 March 2020. The single user search gives a map focused on that user without showing the interactions between other users (Figure 1). We need an additional step to transform the data.
Another quirk of Twitter data extraction allows us to extract original tweets back as far as we like, as long as we have the unique tweet ID. This is the number at the end of a tweet URL – e.g. for this BMJ tweet it is 1236199998192312320. I extracted the tweet and retweet IDs from the map in Figure 1 and imported the original tweets into a conventional social network map. This step identifies the original tweets that the BMJ retweeted, showing us connections between tweeters (Figure 2). NodeXL also groups tweeters into communities according to tweeting patterns.
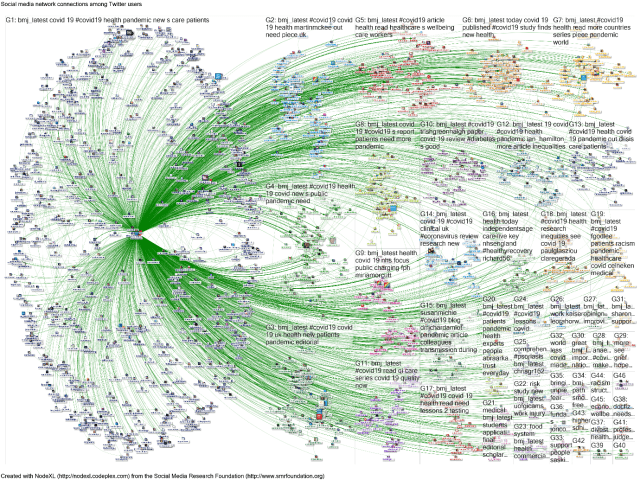
Figure 2 shows different types of connections – for example if mentioned in a tweet, if replied to or replying to a tweet, or if retweeting a post. This map demonstrates that the BMJ interacts broadly with its readers. Of the 3,196 tweets successfully extracted, 1,996 tweets were posted by the BMJ, mentioning 685 tweeters. The remaining 1,200 tweets (38%), each retweeted by the BMJ, were posted by 665 tweeters.
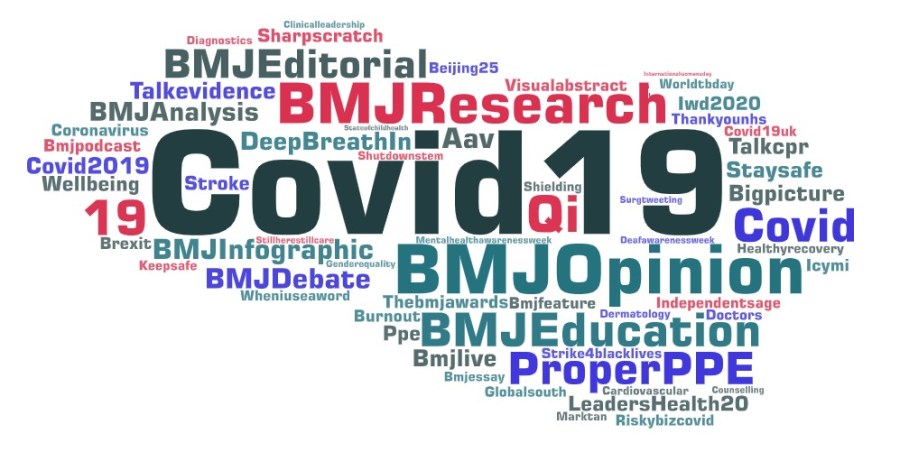
Covid-19 and associated terms were the most used hashtags (Figure 3). The Wakelet summary lists the top tweets posted or retweeted by the BMJ in chronological order. Each tweet included in this summary received at least 100 retweets. These can be considered “viral tweets”: despite over 400,000 followers, on average the BMJ receives a median of 16 retweets per tweet. Examples of covid-19 coverage included face-to-face and remote assessment in primary care, health inequalities, moral injury and PPE shortages in healthcare workers, face covering, prediction models, risks for black and minority ethnic populations, lessons in loosening lockdown, mental health, schools reopening, concerns about poor quality research and lack of trust in government. The top tweets were not just about covid-19. Tackling racism in healthcare was discussed before lockdown started. Gabapentinoids in managing pain were the subject of a popular infographic. The impact of trade agreements on the NHS was also covered. The breadth of coverage in BMJ tweets and retweets – both for covid-19 and more generally – is impressive and reflects the healthcare and public health focus of the journal and readership.

This blog demonstrates the use of the “popularity” of a tweet to help sift through a lot of social media data. Applying this approach to the BMJ’s tweets during the pandemic has illustrated the breadth of the journal’s content and has helped identify the “viral content” posted and shared by the journal. Social media is a two-way process. The 120 tweets listed in the Wakelet summary were shared widely – 4% of tweets posted by 1.6% of tweeters in Figure 2 received 30% of all retweets. We can start to understand the most engaging content through the eyes of the journal’s readers and social media followers. This is useful information, but would have been missed had this analysis been attempted just a few days later. Just as the paper journal gets recycled, and tweets move as if by gravity towards the bottom of our screens, social media data is only available transiently. Blink and you miss it. Retrospective data collection becomes very expensive. Healthcare organisations, individual healthcare workers and journals need to adapt to understand a world where social media is integral to learning. Covid-19 accelerates this process.
Dr Graham Mackenzie, GPST2, Edinburgh, Scotland
7 August 2020.

