
This blog provides access to data on tweets using the #Covid19UK hashtag during the UK lockdown, the first day of which began on 24 March 2020. The data were extracted using TAGS, and then mapped using NodeXL. There were of course other UK-focused hashtags used during this period and some UK-based Covid-19 tweeting that did not use any hashtag. However it was unfeasible to capture all the data. I therefore stuck with one hashtag all the way through. You can see further information, including other search terms and ways of presenting data, in a tweet thread. These data are updated on a weekly basis (except where there is too much data to plot at once, in which case they are charted by day). There’s more about this work on the BMJ Opinion blog.
Details are provided below, but you may want to start with the summary outputs by month between March/ April and December. These summarise the top tweets (by number of retweets received) until end of July 2020, before moving to a different approach from August 2020 onwards where I attempt to capture more diversity in tweeters by making sure that no tweeter has more than 3 tweets in the summaries. Click to go to the Wakelet summary. Note that some tweets may have subsequently been deleted by Twitter or the tweeter, and some users will have left Twitter or been suspended. Accordingly, I have included PDF summaries that capture a permanent record. Links to the PDF summaries are included in the Wakelet summaries for each month:
- 20 March to end of April 2020
- May 2020
- June 2020
- July 2020
- August 2020
- September 2020
- October 2020
- November 2020
- December 2020
- January 2021
- February 2021
- March 2021
- April 2021
- May 2021
- June 2021
- July 2021
- August 2021
- September 2021
- October 2021
- November 2021
- December 2021
- January 2022
- February 2022
From March 2022 I have not been producing Wakelet summaries, but the full data are available in NodeXL maps (data at end of each NodeXL report):
I aim to combine outputs from this period into a summary Wakelet when time.
The URLs in the table point to NodeXL reports that describe the data more fully. Note that some of the early days of the UK lockdown had so much tweeting that it was not possible to obtain a complete data set (either because of the 18,000 tweet & retweet limit or because of difficulties accessing the Twitter API; you can only extract Twitter data 7-10 days into the past). Fortunately NodeXL also allows us to look at the tweet data for posts retweeted during the periods where there are data. That means that we can access some of the more popular tweets from the periods that were “missed”. For example, for 20 March, pre-lockdown, there were only 8 hours 21 minutes of data extracted (15:38 to 23:59). However, retweets during this period allowed the identification of tweets going back over 2 weeks. The following graph shows daily data from 3 to 17 March and hourly data thereafter, plotting tweets but not retweets.

Click into the links in the table below to see the NodeXL reports. These are typically weekly reports, starting each Tuesday (as the lockdown began on a Tuesday). Scroll down to the bottom of the NodeXL reports to download the raw data (unless the table below has a link for “data”, in which case the file was too large to upload to the NodeXL Graph Gallery, and needed to be uploaded to Dropbox instead). In the NodeXL reports select the link – “Download the Graph Data as a NodeXL Workbook”. Sometimes there was just too much data to analyse in one go, so I have processed them in days instead. Most of the NodeXL reports were produced in September or October. That means that some of the tweets had been deleted, retweets retracted, sometimes accounts deleted. For example, for 24 March – re-extracted on 1 October – 14,735 tweets and retweets were identified out of 16,192 originally collected. There may be some interesting findings from looking at the posts that have disappeared in the intervening period – perhaps some were from “troll farm” and bot accounts that have been removed. I have a lot of the original TAGS data, which will allow further study of this question.
NodeXL graphs (e.g. the graph below for 24 March) show Twitter accounts that tweeted, retweeted, and/or were mentioned in tweets. These are called “vertices”. You can read more about how to interpret these maps in an article by NodeXL and Pew Research. You can also read a lot more about how to analyse and interpret the raw data on the ScotPublicHealth blog and in my papers published in peer-reviewed medical journals.
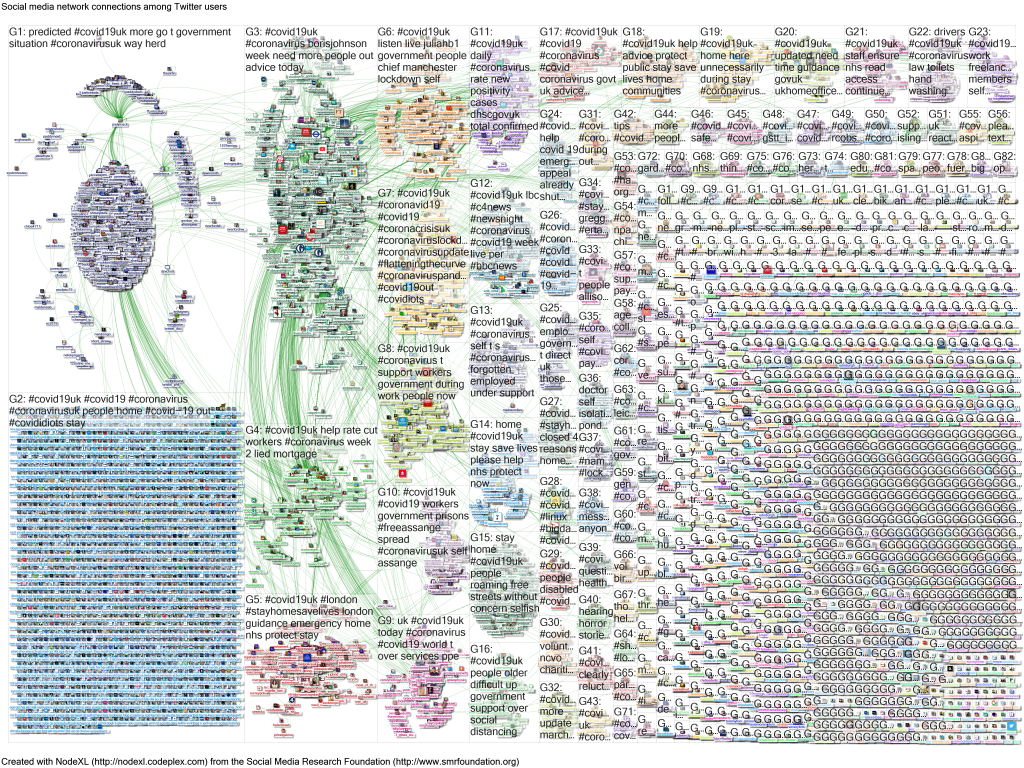
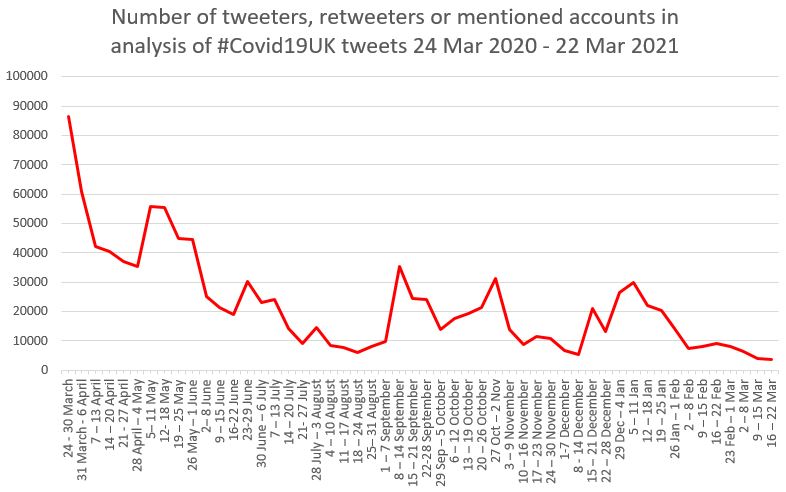
The number of Twitter accounts included in the weekly extracts has varied over time, peaking at the start of lockdown, a quiet period over the summer, an increase during September as we contemplated a return of stricter lockdown rules, and again the week before 2nd lockdown rules were introduced in England (2nd national lockdown commenced 5 November), with further restrictions for 26 December and nationwide lockdowns announced 5 January 2021.
Hopefully there will be time over coming months to analyse these data in collaboration with academic teams. Please contact me if you are interested in contributing. However, for the moment my focus is on GP exams and clinical work. Watch this space for further data over coming months.
| Week of lockdown | Dates | Vertices (*) | URL to access data |
| Pre lockdown (4 days) | 20-23 March | 50737 | 20 March 21 March 22 March 23 March |
| 1 | 24 – 30 March | 86348 | 24 March 25 March 26 March 27 March 28 March 29 March 30 March |
| 2 | 31 March – 6 April | 61084 | 31 March 1 April 2 April 3 April 4 April 5 April 6 April |
| 3 | 7 – 13 April | 42330 | Report Data |
| 4 | 14 – 20 April | 40443 | Report Data |
| 5 | 21 – 27 April | 36964 | Report Data |
| 6 | 28 April – 4 May | 35491 | Report Data |
| 7 | 5– 11 May | 55688 | Report Data |
| 8 | 12- 18 May | 55377 | 12 May 13 May 14 May 15 May 16 May 17 May 18 May |
| 9 | 19 – 25 May | 44803 | Full week |
| 10 | 26 May – 1 June | 44714 | Full week |
| 11 | 2– 8 June | 25091 | Full week |
| 12 | 9 – 15 June | 21481 | Full week |
| 13 | 16-22 June | 18857 | Full week |
| 14 | 23-29 June | 30340 | Full week |
| 15 | 30 June – 6 July | 23065 | Full week |
| 16 | 7 – 13 July | 24174 | Full week |
| 17 | 14 – 20 July | 14243 | Full week |
| 18 | 21- 27 July | 9191 | Full week |
| 19 | 28 July – 3 August | 14549 | Full week |
| 20 | 4 – 10 August | 8357 | Full week |
| 21 | 11 – 17 August | 7618 | Full week |
| 22 | 18 – 24 August | 6125 | Full week |
| 23 | 25– 31 August | 8143 | Full week |
| 24 | 1 – 7 September | 9774 | Full week |
| 25 | 8 – 14 September | 35498 | Full week |
| 26 | 15 – 21 September | 24634 | Full week |
| 27 | 22 – 28 September | 24250 | Full week |
| 28 | 29 Sep – 5 October | 13756 | Full week |
| 29 | 6 – 12 October | 17766 | Full week |
| 30 | 13 – 19 October | 19491 | Full week |
| 31 | 20 – 26 October | 21560 | Full week |
| 32 | 27 Oct – 2 Nov | 31373 | Full week |
| 33 | 3 – 9 November | 13967 | Full week |
| 34 | 10 – 16 November | 8932 | Full week |
| 35 | 17 – 23 November | 11577 | Full week |
| 36 | 24 – 30 November | 10993 | Full week |
| 37 | 1 – 7 December | 6670 | Full week |
| 38 | 8 – 14 December | 5527 | Full week |
| 39 | 15 – 21 December | 21024 | Full week |
| 40 | 22 – 28 December | 13065 | Full week |
| 41 | 29 Dec – 4 Jan 2021 | 26346 | Full week |
| 42 | 5 – 11 January | 30037 | Full week |
| 43 | 12 – 18 January | 21996 | Full week |
| 44 | 19 – 25 January | 20418 | Full week |
| 45 | 26 Jan – 1 Feb | 14400 | Full week |
| 46 | 2 – 8 February | 7567 | Full week |
| 47 | 9 – 15 February | 8257 | Full week |
| 48 | 16 – 22 February | 9270 | Full week |
| 49 | 23 Feb – 1 Mar | 8218 | Full week |
| 50 | 2 – 8 Mar | 6356 | Full week |
| 51 | 9 – 15 Mar | 3968 | Full week |
| 52 | 16 – 22 Mar + | 3737 | Full week |
* (number of tweeters, retweeters & mentioned accounts)
+ Note that there is also an extract for 1-23 March 2021 concluding a full year’s worth of data for the 1st anniversary of lockdown. Data beyond this point are available from the monthly Wakelet summaries listed at the top of this post.
The write up of the first full year (and a day) of tweeting is available in a Lancet Infectious Diseases Media Watch article.
Dr Graham Mackenzie, Edinburgh, Scotland
Updated 3 September 2022

