
This blog takes a real life example (the Royal College of Physicians Edinburgh Public Health symposium 2017 – #rcpePH17) to illustrate ways to use social media in planning, running and summarising the outputs of the conference. You can also read a PDF version of this blog. Read a more recent application of some of these techniques to study infectious disease conferences in a Media Watch article for Lancet Infectious Diseases (February 2018).
Social media summary and analysis of #rcpePH17
Introduction
The world is rapidly changing and in order to respond to the needs of public health we must also develop and adapt the tools we use to engage with others and evoke change. At the Royal College of Physicians Edinburgh (RCPE) symposium “Public Health in a Changing World” (31 May 2017) some of the tools for change that could be used to improve public health were considered, one of which was the use of social media. This report reflects on the part that social media played in disseminating the learning from the symposium and the resulting impact the symposium had internationally. The social media preparation undertaken in advance of the symposiuim is described, in addition to the work done during the event and afterwards. Read the rapporteur write up by authors Emma Fletcher and Graham Mackenzie (GM) here.
Pre-symposium planning
As part of the pre-symposium planning we considered the various social media options available to use and decided that Twitter was the optimum for the following reasons:
- Twitter can reach a large audience with little investment other than time. Therefore it was a valuable way in which the symposium could be promoted and ideas shared in advance, at minimal cost, with the aim of generating interest in and encouraging attendance at the symposium.
- We were keen to capture high quality images and key learning points from the conference, ideally with links to further reading, and considered tweets the best way to do this. The intention was to reach an audience beyond the conference hall on the day of the symposium and subsequently use the tweets to produce a summary for future use.
We set out to apply social media tools in an attempt to measure reach and interactions through analysis summarised on the ScotPublicHealth.com website.
Building an audience/ forging alliances/ starting discussions
Social media for professional use has three broad purposes – broadcasting, networking and learning. Each of these functions were relevant prior to the symposium. Colleagues who had many social media followers (eg Dr Andrew Murray and Prof Chris Oliver) tweeted messages with a Public Health theme, attractive images, and the URL to the symposium webpage (for programme, booking and enquiries). See figure 1 for an example.
Figure 1) Andrew Murray tweet (9 Feb 2017) promoting up stream approaches

Source: Twitter
Tweets mentioned confirmed speakers including Prof Martin McKee(1,2), Dr Helen Bevan(3), and related organisations (eg Chatham House Centre on Global Health Security for Prof David Heymann(4)) . The tweets highlighted to followers the high calibre speakers who had confirmed for the event and, in turn, signalled to the speakers the promotional activity around the symposium and encouraged the speakers to retweet messages to their own extensive networks.
The tweets tried to achieve a balance between providing subject specific material (eg an image about Zika for emerging infections presentation by Prof Heymann) and advice about tweeting effectively (eg a decision tool for tweeting at conferences – figure 2).
Figure 2) @gmacscotland tweet (9 Feb 2017) giving advice about tweeting at conferences
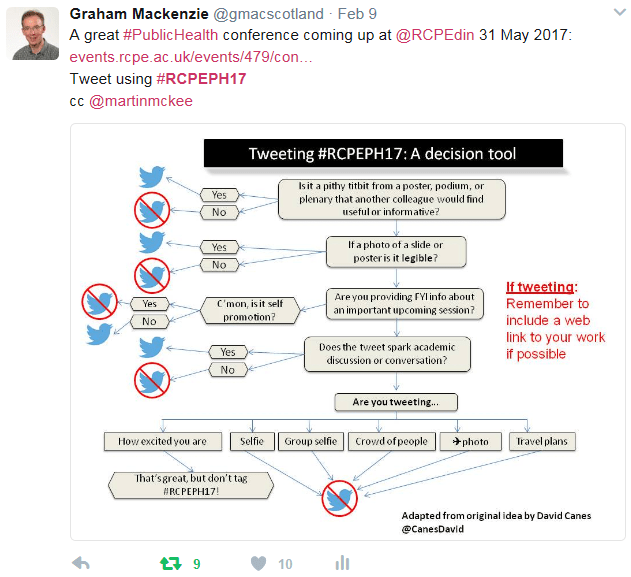
Source: Twitter
We can draw out simple measures for an individual tweet, including number of “retweets” (number of times tweet has been shared to another Twitter user’s followers), “likes” and replies. For example, Andrew Murray’s tweet in figure 1 had been retweeted 23 times, and liked 63 times by the time of the symposium.
Andrew Murray and Helen Bevan replied to messages about the symposium, for example discussing the use of NodeXL maps to illustrate interactions between tweeters(5). Andrew and Helen reported becoming familiar with each other’s work, largely through their social media activity.
Of note, the College also tweeted a series of messages about the symposium during March, publicising the speakers, but few were retweeted or ‘liked’. This is likely because the College tweets chose not to include an image(6).
Individual Twitter users can extract more detailed information from their own tweets by clicking the Twitter Analytics (bar chart) symbol at the bottom of the tweet(7). Figures 3 and 4 provide examples of this information for the @gmacscotland account, using #rcpePH17 tweets. These tweets are provided for illustrative purposes, to capture the range of interactions for two individual tweets. Looking across all tweets that GM posted during May using the hashtag his tweets achieved a median of 840 “impressions” (range 13-14,252; interquartile range 581-1,518 impressions). For the Twitter Analytics site “impressions” records the number of times a tweet is displayed on a Twitter enabled device. This information is useful when comparing data with other social media analytical tools, as discussed later.
Figure 3) Metrics from a @gmacscotland tweet (9 February 2017)
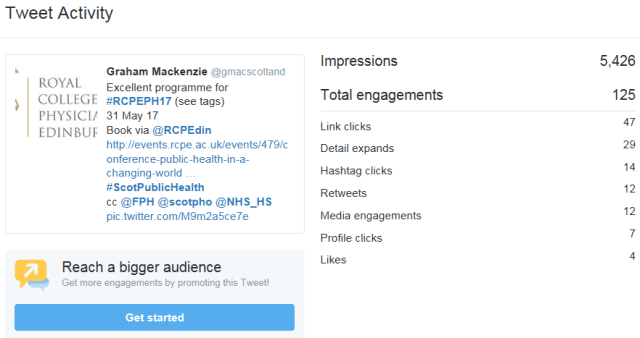
Source: Twitter Analytics (only available to individual user)
Figure 4) Metrics from a @gmacscotland tweet (10 February 2017)
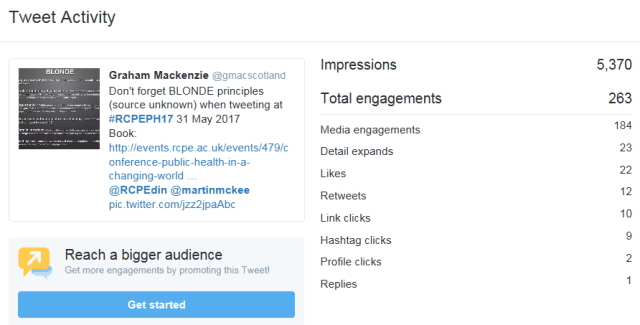
Source: Twitter Analytics (only available to individual user)
The tweet shown in figure 4 passed across devices running Twitter 5,370 times (“impressions”), with 184 people clicking into the image, 10 people clicking into the link (symposium website), and 9 people clicking the #rcpePH17 hashtag. The “conversion rate” (impressions to link click for example) varied by tweet. It is thought this was due in part to content, but also timing of tweet and a degree of luck. It is not possible to see this level of detail for other users. It is not possible either to discern from social media data alone whether any of these pre-symposium tweets led to new registrations for the symposium, but by using the measures of retweets and likes it can be shown that the pre-symposium tweets were seen by other users and led to other interactions. It is notable that the tweets posted prior to the symposium did not lead to confrontation or dispute, even though they covered publicly some of the more contentious topics covered on the day (eg Brexit, the NHS, and health more widely).
Producing a record of the symposium: We set out to produce an accurate and comprehensive record of the symposium for delegates and others potentially interested in the topic. Delegates were invited to tweet using the symposium hashtag (#rcpePH17). Speakers were asked for their slides, either in advance or on the day, and these were used to identify key images to post on Twitter, and the URLs of any published academic papers or other materials clearly identified in the slides.
The usernames of speakers – or their institution if individual speakers were not on Twitter – were referred to in the relevant tweets.
GM posted from his own account (@gmacscotland), a Scottish public health account that he runs (@ScotPublic) and an international feed (@WePublicHealth) that he had agreed to guest edit for a week. This meant that he could spread the tweets across different accounts and retweet selected tweets from the other two accounts which had the benefit of extending reach without overwhelming individual Twitter feeds. Some tweets were scheduled in advance using Twitter’s Tweetdeck function.
After the symposium a ‘Storify’ summary was used to collate the tweets from the dozens of tweeters who were active before, during and after the symposium. The ‘Storify’ grouped the tweets during the conference by session and speaker, and summarised the more general points about the conference, including individual feedback, and social media metrics(8). The ‘Storify’ summary was posted on the evening of 31 May, and was tweeted by Helen Bevan on 2 June.
The summaries produced by ‘Storify’ include both images and text (albeit with the occasional glitch in formatting), and provide an accessible and attractive summary showing number of replies, retweets and likes. Within the ‘Storify’ summaries, viewers are able to click into individual tweets. The number of tweets for a typical RCPE symposium makes this process manageable using a simple search of the symposium hashtag. However, when the event is larger, it is possible to use some of the Twitter “big data” techniques described in the next section to extract and sort tweets to produce a Storify summary relatively quickly(9).
Using Twitter analytical tools and “big data” approaches to measure reach and interactions: GM has written previously about analysis of Public Health awareness campaigns(10) and conferences(11) and published an editorial on this work with Andrew Murray and Prof Chris Oliver in the British Journal of Sport Medicine(12).
There are simple Twitter metrics available from the websites ‘Symplur health hashtags’ and ‘Followthehashtag’, which report Twitter analytics in aggregate(13,14). The Symplur statistics are shown in figure 5.
Figure 5) Metrics for day of #rcpePH17 (31 May 2017)

Source: Symplur health hashtags website
The estimates using these tools are summarised in table 1. There are differences between tools in terms of the types of data available, and the estimates produced.
Table 1. Basic social media metrics from #rcpePH17
| #rcpePH17 | Symplur health hashtags | Followthehashtag |
| Tweets and retweets | 1,251 | 1,443 tweets/ retweets (263 “original tweets”) |
| Tweeters and retweeters | 460 | 581 |
| Impressions (estimated) | 6.2 million | 7.3 million |
| Audience | Not available | 1.1 million |
Followthehashtag provides geographical mapping (figure 6), showing interest in the symposium (tweets and retweets) from across the world, plus a list of top tweets (figure 7). There are strengths and limitations to the two sites as explored in discussion, but together the information demonstrates a huge potential reach from #rcpePH17.
Figure 6) Metrics for period of hashtag (7 February to 31 May 2017)
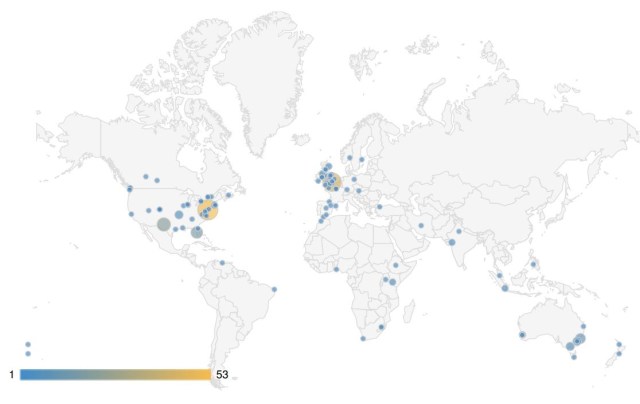
Source: Followthehashtag
Figure 7) Top retweets, from Followthehashtag website

Source: Followthehashtag
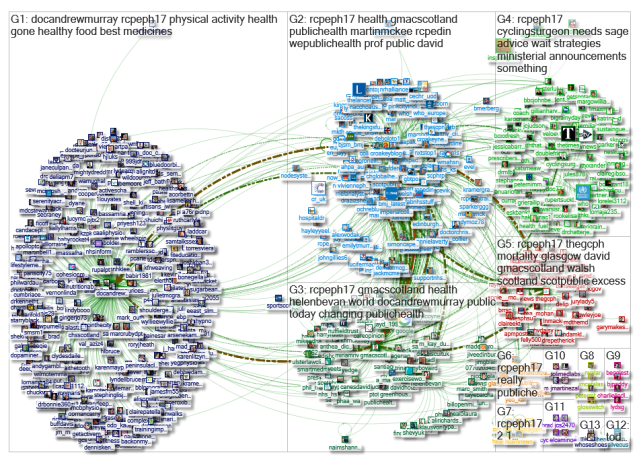
NodeXL is an Excel add-in which extracts tweets and retweets from the previous 9-10 days, and analyses and maps the interactions between tweeters (replies, mentions and retweets). Figure 8 shows the NodeXL analysis before and after the symposium. An animation of the evolution of the latter map is also available.(15) The NodeXL report provides a list of key influencers, top URLs and hashtags, word pairs and a word sentiment analysis (appendix). This gives a rapid summary of top topics and influencers.
Figure 8) NodeXL analysis of tweets using #rcpePH17 hashtag before and after symposium

Source: NodeXLGraphGallery
Source: NodeXLGraphGallery
Discussion: This summary presents some of the key findings from social media analysis of #rcpePH17. This was a particularly well-connected symposium, both before and during the conference (see figure 9 for comparison with other recent RCPE symposiums). This was largely due to support from high profile tweeters before and during the symposium, and was helped by a little serendipity as I was guest editing a public health Twitter feed with global reach that week.
Figure 9) NodeXL maps for #rcpeCOE17 (extracted 15 March 2017 after symposium) and #rcpeStAs16 (extracted 2 December after two day symposium)

Source: NodeXLGraphGallery

Source: NodeXLGraphGallery
There are strengths and limitations to the different approaches used here:
- Symplur is very easy to use and free, but cannot be used for analysis beyond a 120 date range or for tweets posted more than a year ago, limiting use for ongoing campaigns such as #VaccinesWork. It allows an extract up to 120,000 tweets, which is enough for most analyses. It does not provide audience statistics (ie number of individuals potentially seeing the tweets) or information about top tweets or interactions for individual tweeters, but does identify those tweeters with largest number of impressions, tweets and mentions. It is useful for an instant measure of reach and influencers, who can then be tagged or mentioned in tweets. Unfortunately the estimate of “impressions” (potential views) is a crude estimate, based on total number of tweets posted by a users multiplied by number of followers, which is likely to be a large overestimate of views in many circumstances. See previous blog for more detail. As an illustration, using data from the #rcpePH17 analysis, whereas Twitter Analytics gives a median of 840 impressions per tweet for GM’s tweets, Symplur would use number of followers (at that point ~9,700 followers). Symplur therefore appears to overestimate number of “impressions” by a factor of 11.5. On this basis the number of “impressions” for the symposium was not 6.2 million, but 540,000.
- Followthehashtag is easy to use, free for small analysis (up to 500 tweets), but charges a small sum for a medium size analysis (up to 1,500 tweets). Reports take a few minutes to run. It would only therefore provide a snapshot for a larger campaign. It provides figures on audience, including a map (world, region or national), some measures of influence and extracts a top 10 of tweets. Some outputs are difficult to understand (eg piecharts). Estimates of “impressions” and audience are likely to be large overestimates for the same reason as Symplur.
- NodeXL is more involved to set up and use, and has an annual charge for the professional package. It requires a powerful PC for larger analyses. It does not provide information about audience, but does provide information about interactions. It can be used to study a hashtag, URL, Twitter user or free text. For a hashtag based search Twitter accounts are shown on the map when they mention that hashtag, or another user mentions them along with the hashtag or retweets a post including the hashtag. It is therefore possible to appear on the map (and be identified as an “influencer”) without having actively tweeted using the hashtag (eg see @who, @cr_uk, @thelancet and @bmj_latest, who all appear the map in figure 8 without having tweeted using the hashtag). Accordingly, as with all data sources, the information needs to be interpreted carefully. The information available from the NodeXL report, and the full extract available from the bottom of each NodeXL report, provide insights and opportunities for further analysis beyond the two other tools, as explored in scotpublichealth.com blogs.
Outputs from the different tools can be compared as shown in figure 10, allowing triangulation. There is not a straightforward relationship between the measure of connectedness – “betweenness centrality” – and the other measures. This is not helped by a lack of operational definitions. It appears, for example, that “mentions” in Symplur counts more than just the number of times that the tweeter is mentioned by other users in tweets – it seems to also capture number of tweets by the tweeter and retweets, which is a potentially important difference. Connectedness is influenced by the mention of other Twitter users (particularly if outside usual audience), number of tweets, and interactions around these tweets (retweets and replies). These measures are further influenced by the content of tweets and number of followers. Tweeters with a large number of followers outside the conference room will consider the reception of tweets by this wider audience, and may alter content accordingly (e.g. giving context, keeping content more general). High profile users (eg Andrew Murray, Helen Bevan and Martin McKee who all tweeted and presented) achieved extensive connections, both through the relatively small number of tweets that they posted, some of which mentioned other Twitter users, and by being mentioned by other users. Some other accounts, including the three managed by GM over the course of the symposium, only achieved apparent “influence” by posting relatively large numbers of tweets.
Taken together, along with the individual tweets recorded in the Storify summary, there was generally high quality tweeting in terms of tweets with images and URLs, with extensive interactions around the tweets.
Conclusions: We have used social media tools and techniques to promote and record the conference, with summary outputs including this report and a Storify summary of tweets. Analytics showed not only a wide reach through this activity but also the impact of a small number of prominent tweeters with a large number of followers, including members of the planning committee and speakers. Social media often relies on connections in the real world, though can also spark and foster such connections; the activity around this symposium was no exception
Dr Graham Mackenzie and Emma Fletcher, Consultants in Public Health Medicine in NHS Lothian and NHS Tayside. Blog written 1 June 2017, posted 30 January 2018.
Figure 10) Comparing Symplur health hashtag analysis with NodeXL analysis. NodeXL analysis (on right) is ranked by “betweenness centrality”. Symplur health hashtag analysis (3 columns on left) is ranked by mentions, tweets and “impressions” (potential views). The rankings are compared using the arrows. Two of the influencers – @margaret_iff and @nxtstop1 appear in one column.

Sources: See figure 5 and figure 8 (after symposium)
Appendix. Some details from NodeXL report for #rcpePH17
The NodeXL report provides a list of key influencers, top URLs and hashtags, word pairs and a word sentiment analysis. The top URLs (full NodeXL map) are shown below, with the number of times the links were tweeted or retweeted. David Walsh’s work was the most cited at the conference.
[11] http://www.gcph.co.uk/latest/blogs/641_the_glasgow_effect_and_the_scottish_effect_unhelpful_terms_which_have_now_lost_their_meaning
[10] http://www.euro.who.int/__data/assets/pdf_file/0007/215989/Successes-and-Failures-of-Health-Policy-in-Europe.pdf
[9] http://blogs.bmj.com/bjsm/2017/05/22/world-health-organisation-develop-global-action-plan-promote-physical-activity/
[9] https://twitter.com/gmacscotland/status/869835089080983552
[8] https://www.symplur.com/healthcare-hashtags/rcpePH17/analytics/?hashtag=rcpePH17&fdate=2%2F1%2F2017&shour=7&smin=20&tdate=5%2F30%2F2017&thour=7&tmin=20
[6] https://academic.oup.com/jpubhealth/article/38/2/384/1753511/Charging-migrants-for-health-care-could-compromise
[6] https://twitter.com/rcpedin/status/869910353676840960
[5] https://nodexlgraphgallery.org/Pages/Graph.aspx?graphID=108397
[5] http://www.gcph.co.uk/work_themes/theme_1_understanding_glasgows_health/excess_mortality_comparing_glasgow
[5] http://www.euro.who.int/__data/assets/pdf_file/0004/287158/Intersectoral-action,-policy-and-governance-in-European-healthy-cities-Eng.pdf
Top hashtags are shown below, with numbers in square brackets showing number of tweets and retweets. (SDOH = social determinants of health; WNTD2017 = world no tobacco day 2017, which coincided with the day of the symposium and was mentioned by Prof Derek Bell).
[1105] rcpeph17
[180] publichealth
[72] movementformovement
[43] sdoh
[23] austerity
[22] leadership
[18] wntd2017
[17] brexit
[17] nhs
[13] glasgow
The word sentiment analysis was largely positive (1,225 positive words to 506 negative words, and none angry or violent). This positive balance is perhaps surprising given the focus on health protection, clinical topics and risk factors during some of the sessions, as these have a number of words routinely coded as “negative” in sentiment analysis. Physical activity related terms appear prominently in the top 10 word pairs, explained by the popular tweets by Andrew Murray (see figure 7). Taken together, the hashtags and word pairs shown below also show the breadth of interests from the programme and in the audience, including social determinants of health, major political events and leadership.
[223] physical,activity
[191] public,health
[127] healthy,food
[125] best,medicines
[125] medicines,sleep
[125] sleep,physical
[125] activity,optimism
[125] optimism,fresh
[125] fresh,clean
[125] clean,air

Pingback: Increasing the quality and impact of Public Health tweeting – looking beyond #ScotPublicHealth – #ScotPublicHealth
Pingback: Handing over the reins: crowdsourcing Twitter data on health campaigns – #ScotPublicHealth
Hi nice reading your bllog
LikeLike