
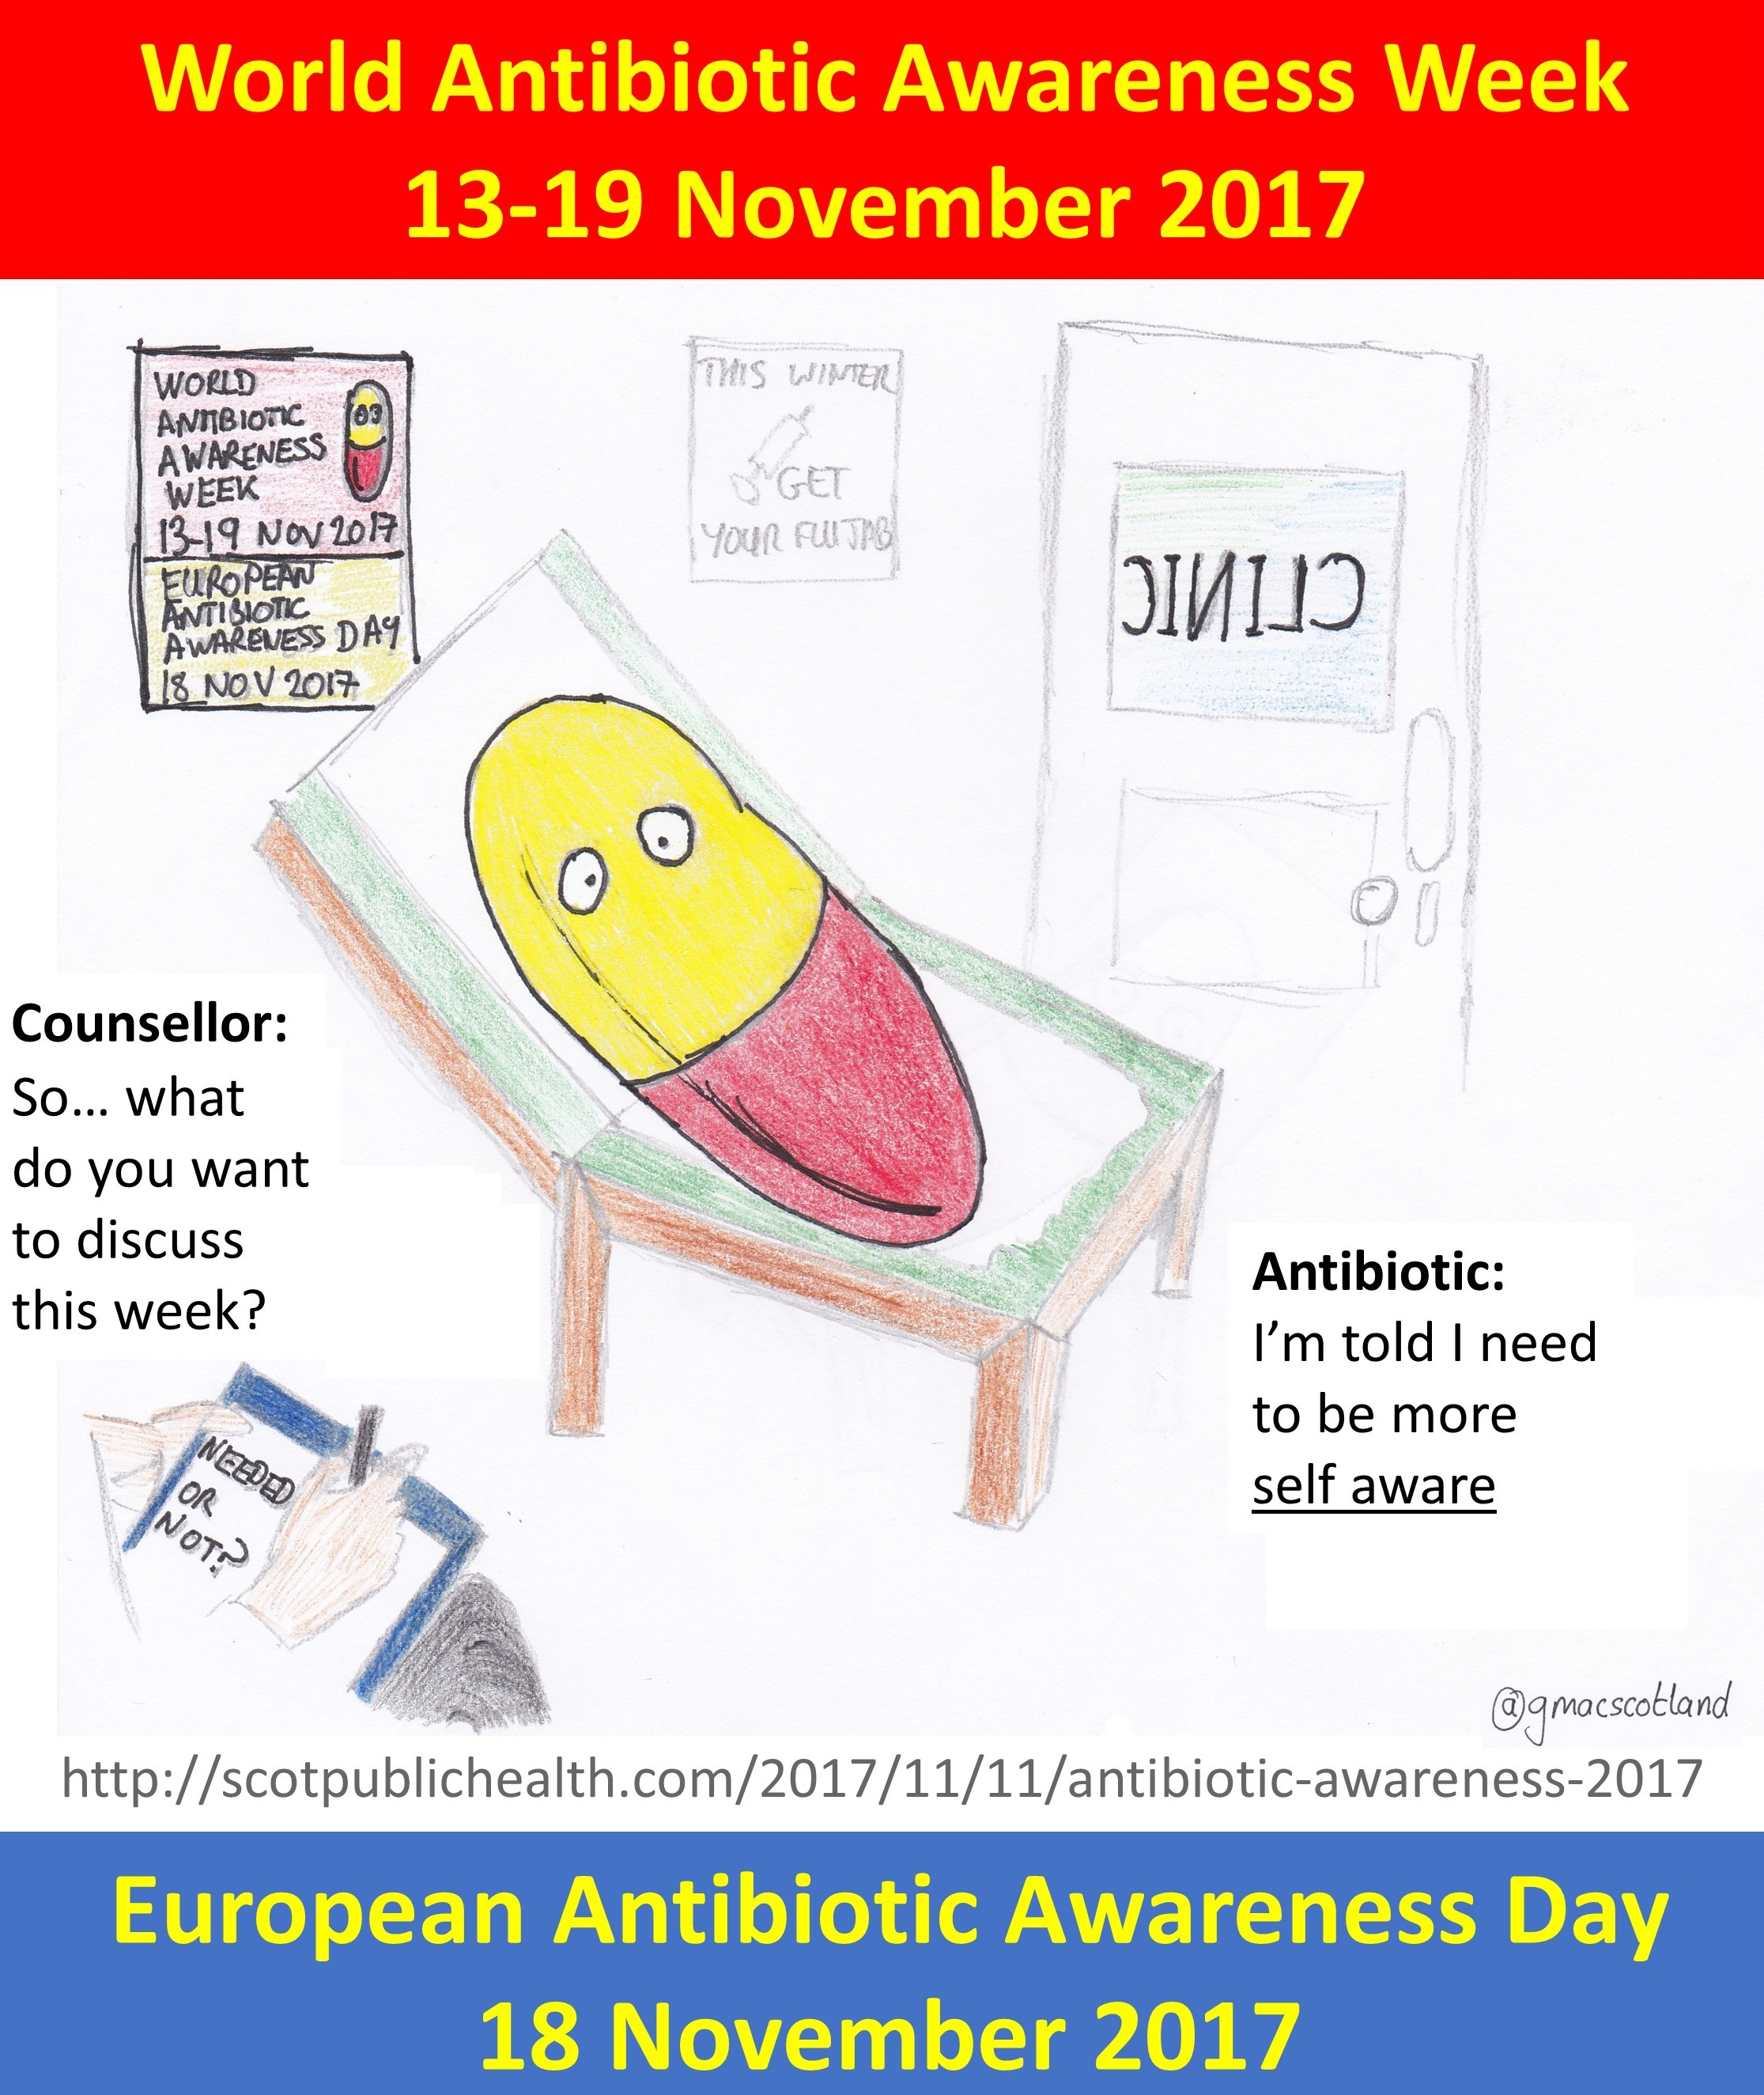
World Antibiotic Awareness Week 2017 runs 13-19 November 2017. European Antibiotic Awareness Day in on 18 November every year. Antibiotic resistance and antibiotic awareness are important public health topics. The World Health Organisation lists prevention and control measures for different sectors including individuals, policy makers, health professionals, healthcare industry and agriculture sector.
As previously discussed on this page antibiotic awareness campaigns attract a lot of tweets – professional and public facing. However it’s not clear which hashtag to use to tweet, or to search for during the week. This blog will be updated throughout the week to help you decide which hashtags to use and search for. I will summarise the top content using “big data” methods, listing the most retweeted tweets across the different hashtags.
The weekend before the campaign I ran a series of “follow the hashtag” searches (to map tweets geographically, and estimate audience) for different hashtags, and three large NodeXL social network maps. Links to these analyses, and top tweets from the NodeXL analyses are provided below. I also produced a graphic of my own to provide a personal touch that I could also track during the course of the week.
The following maps and reports were generated on 11 November 2017 using the Follow the Hashtag website.
| Hashtag
(click for tweets) |
World map
(click image to view) |
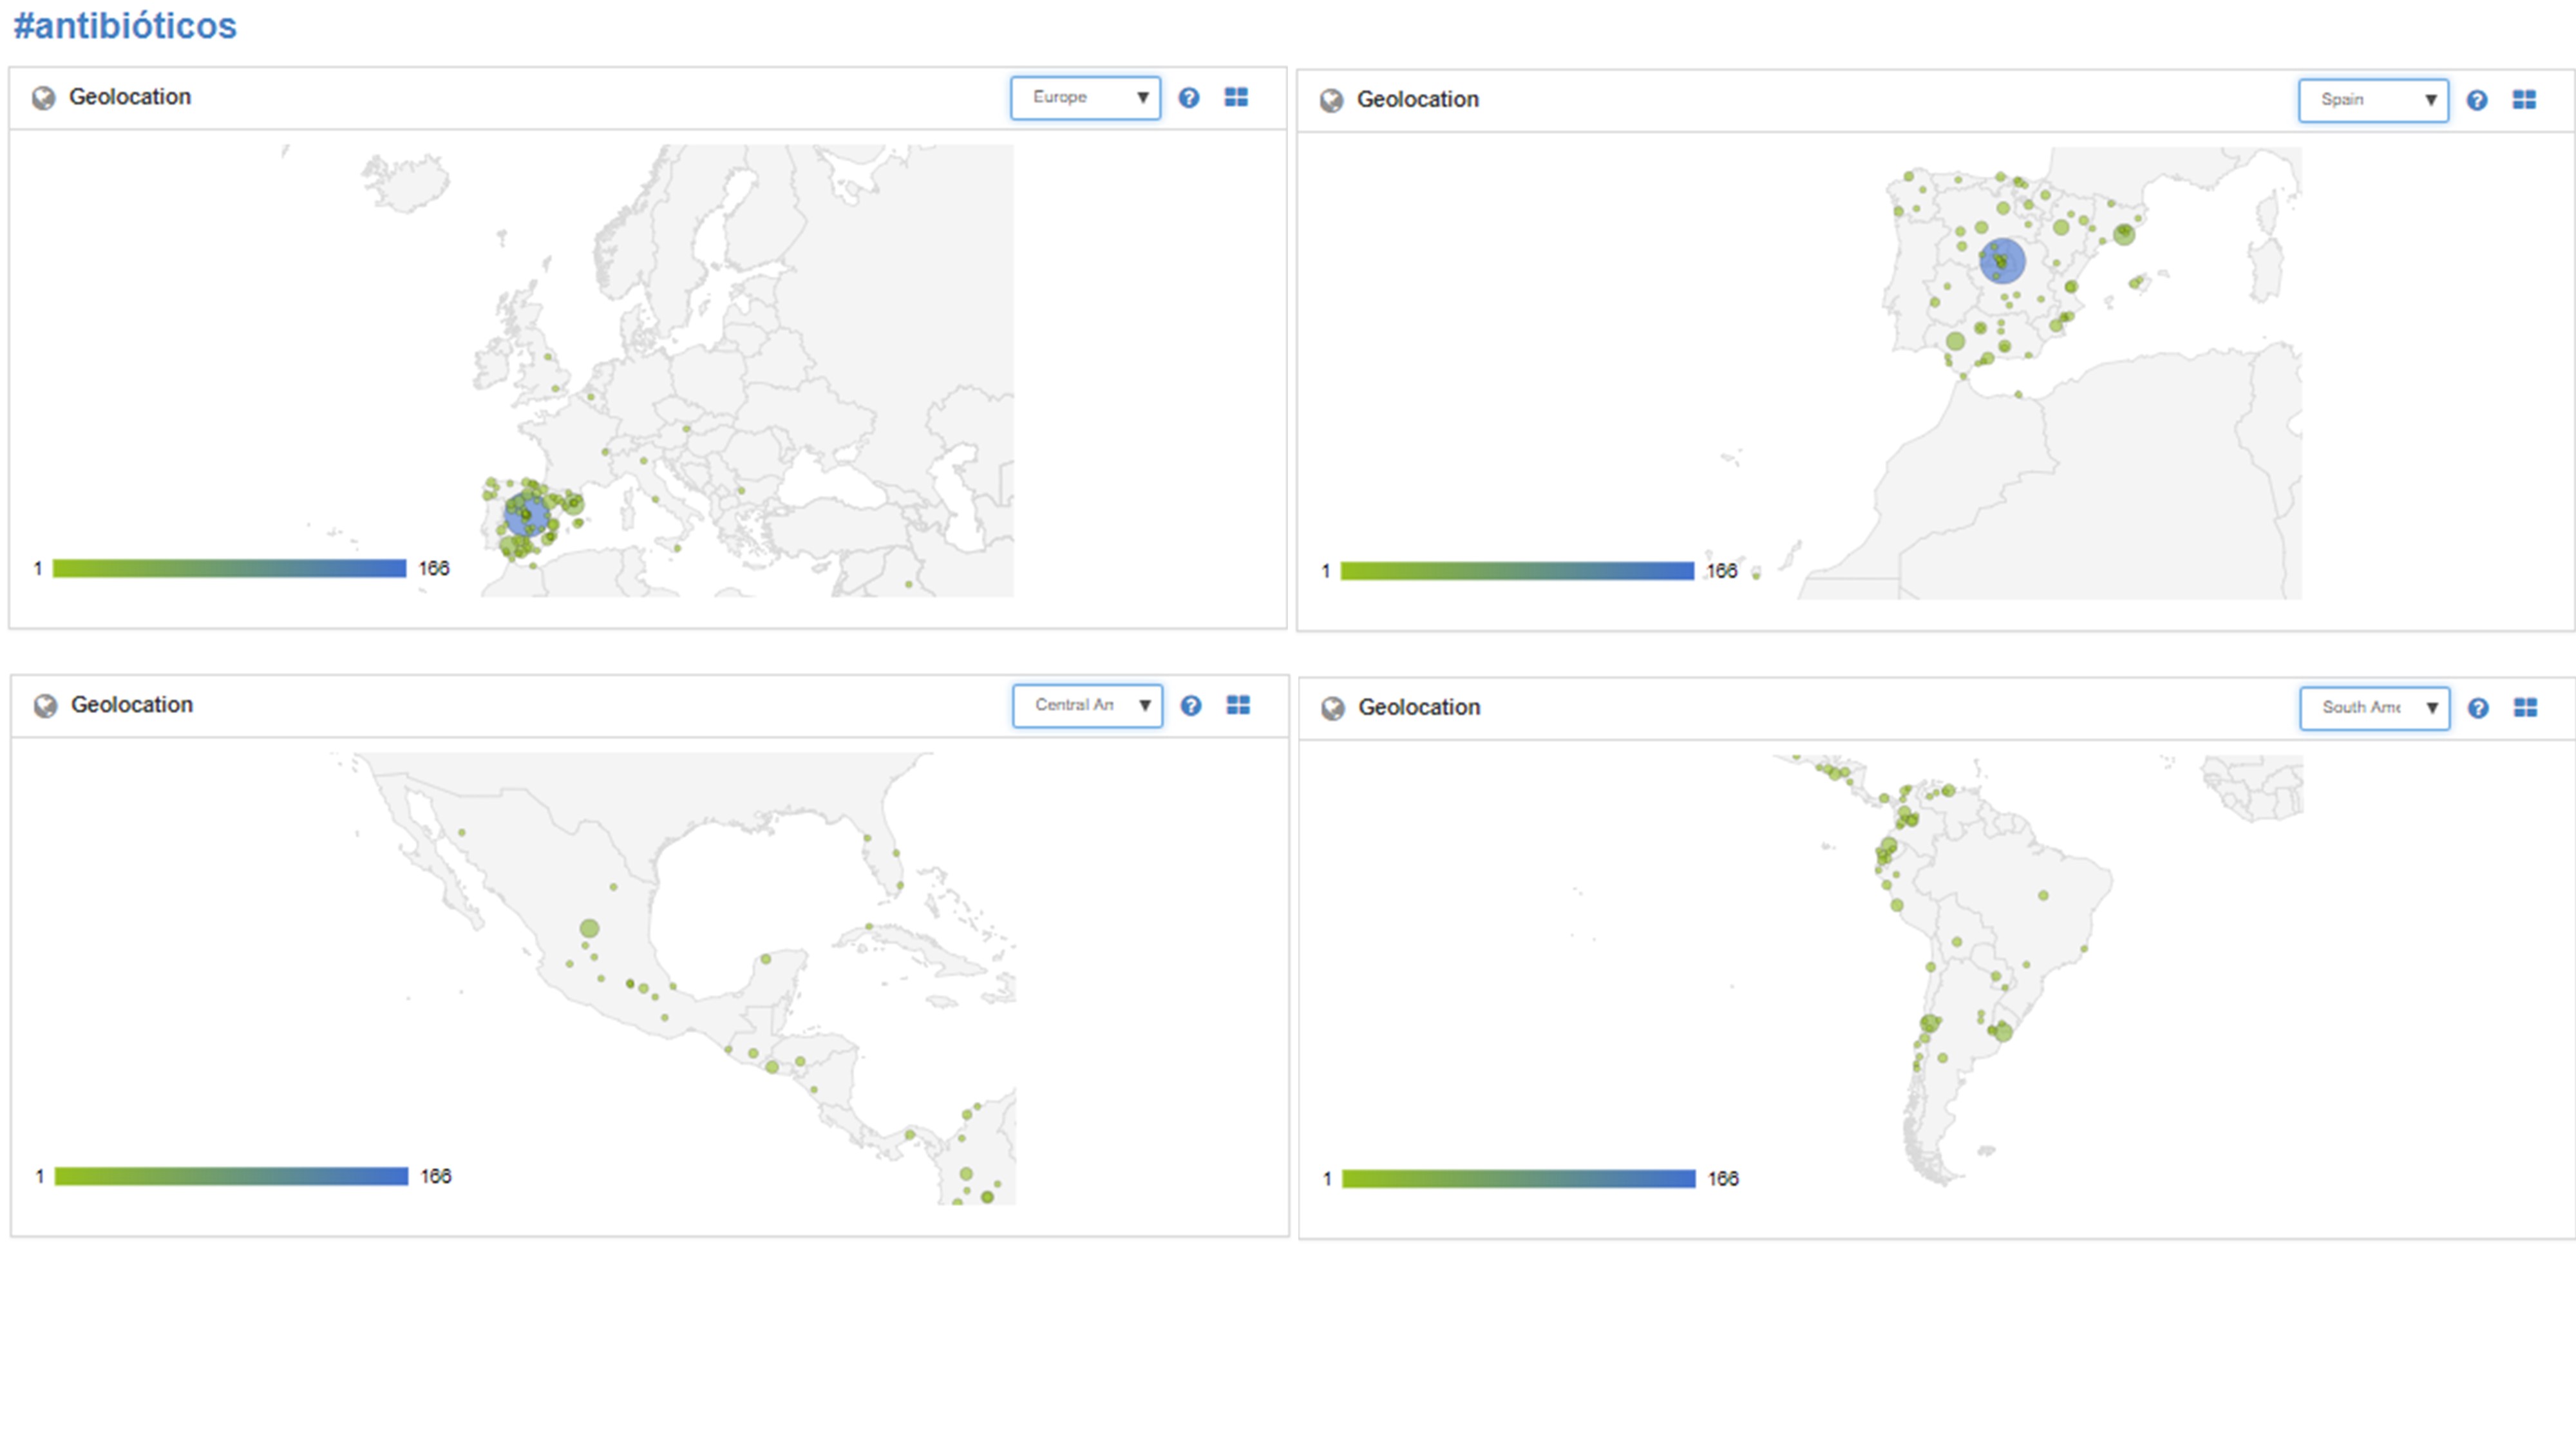
Region maps
(click image) |
Report |
| #Antibióticos | 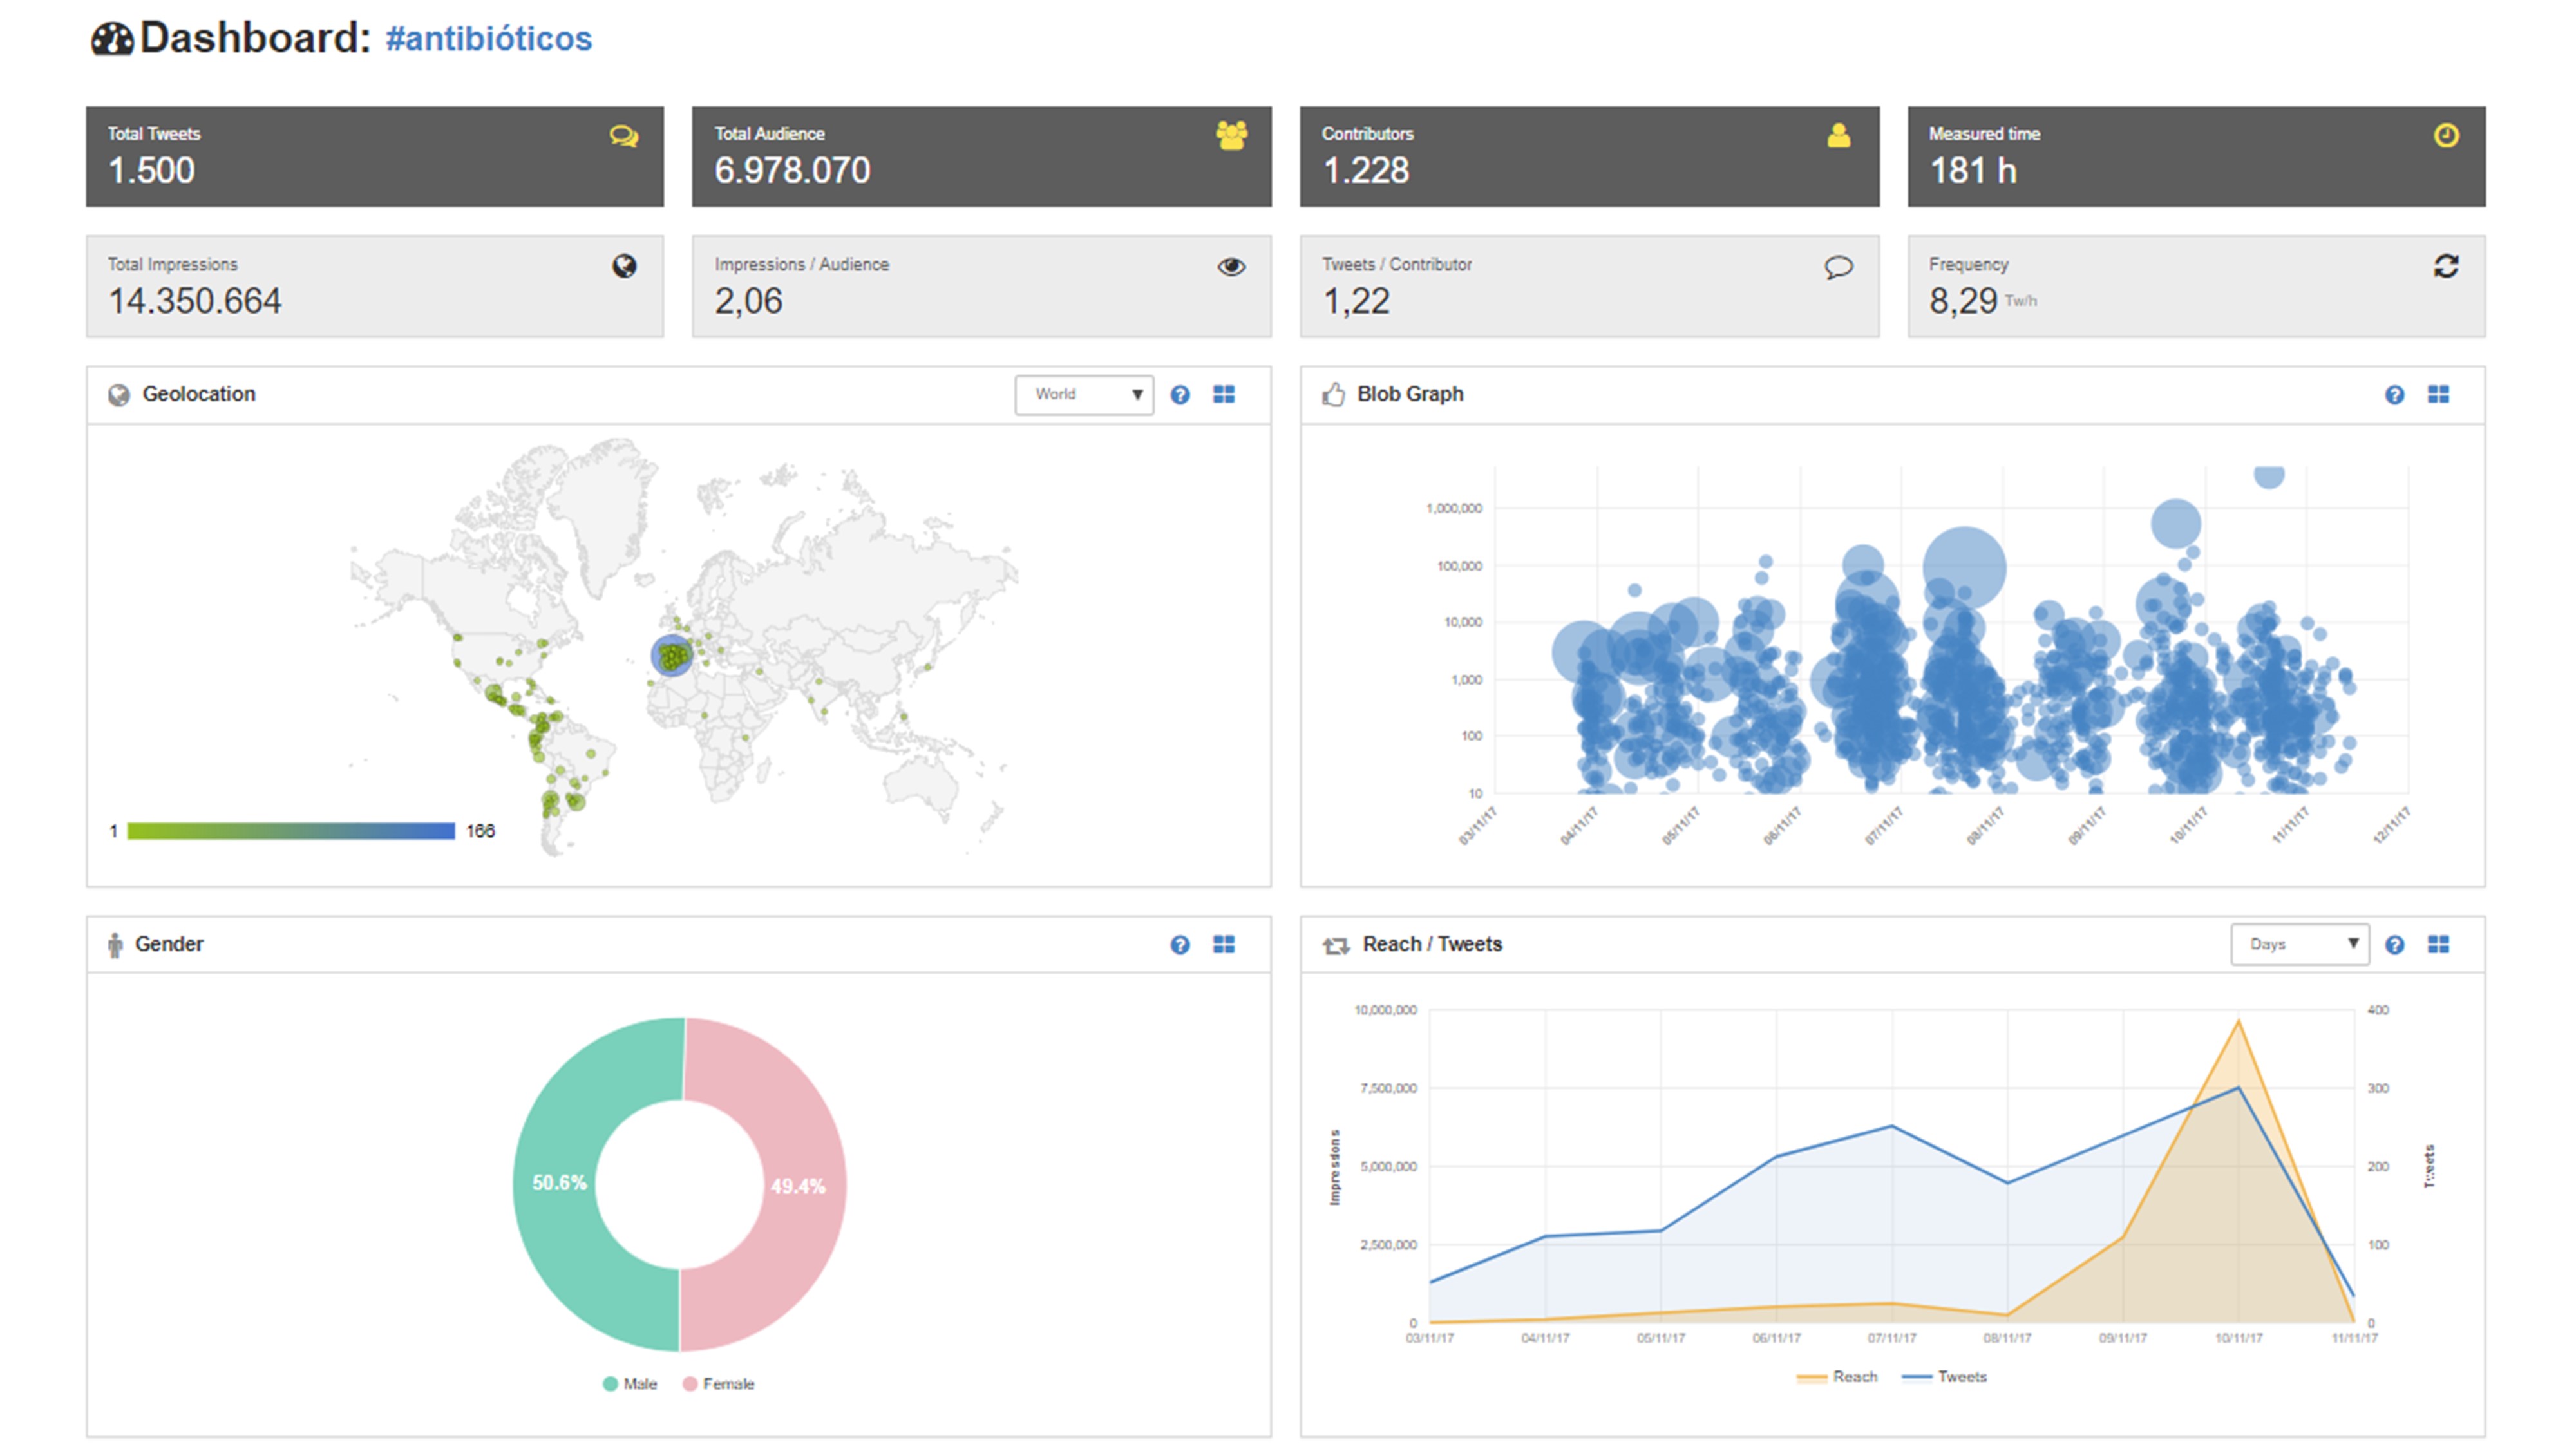 |
 |
Click to view |
| #AntibioticGuardian | 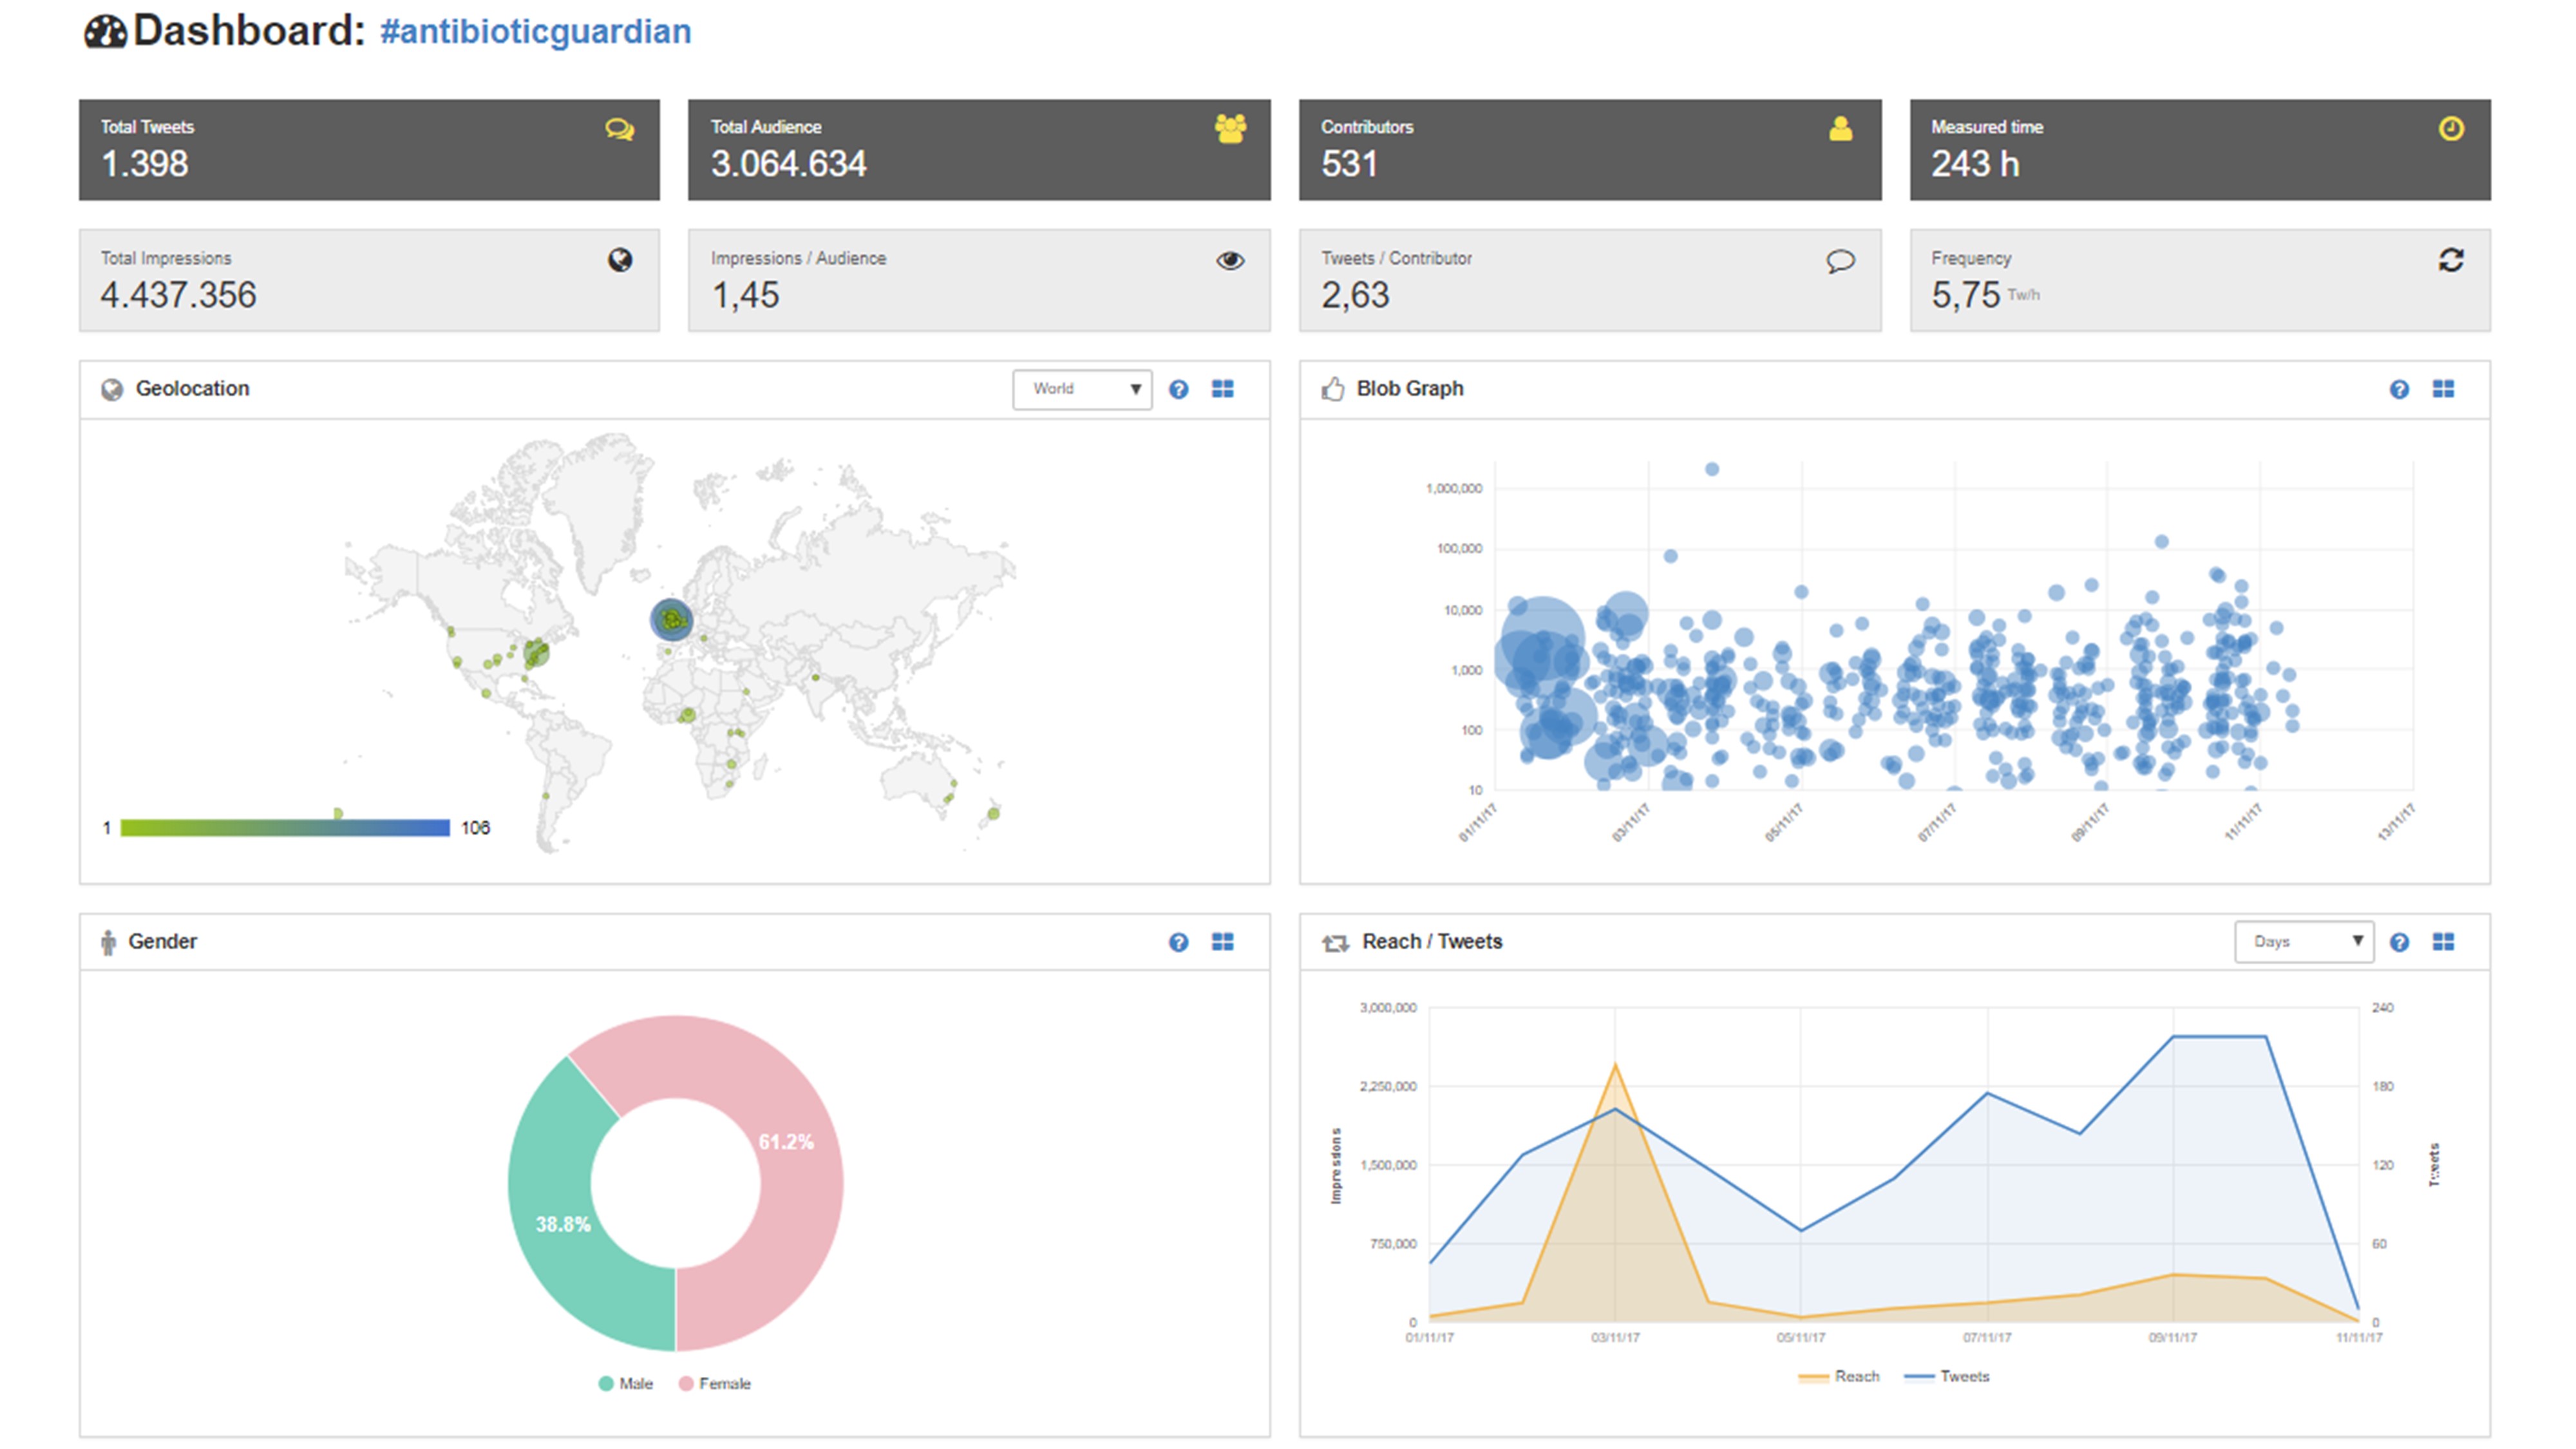 |
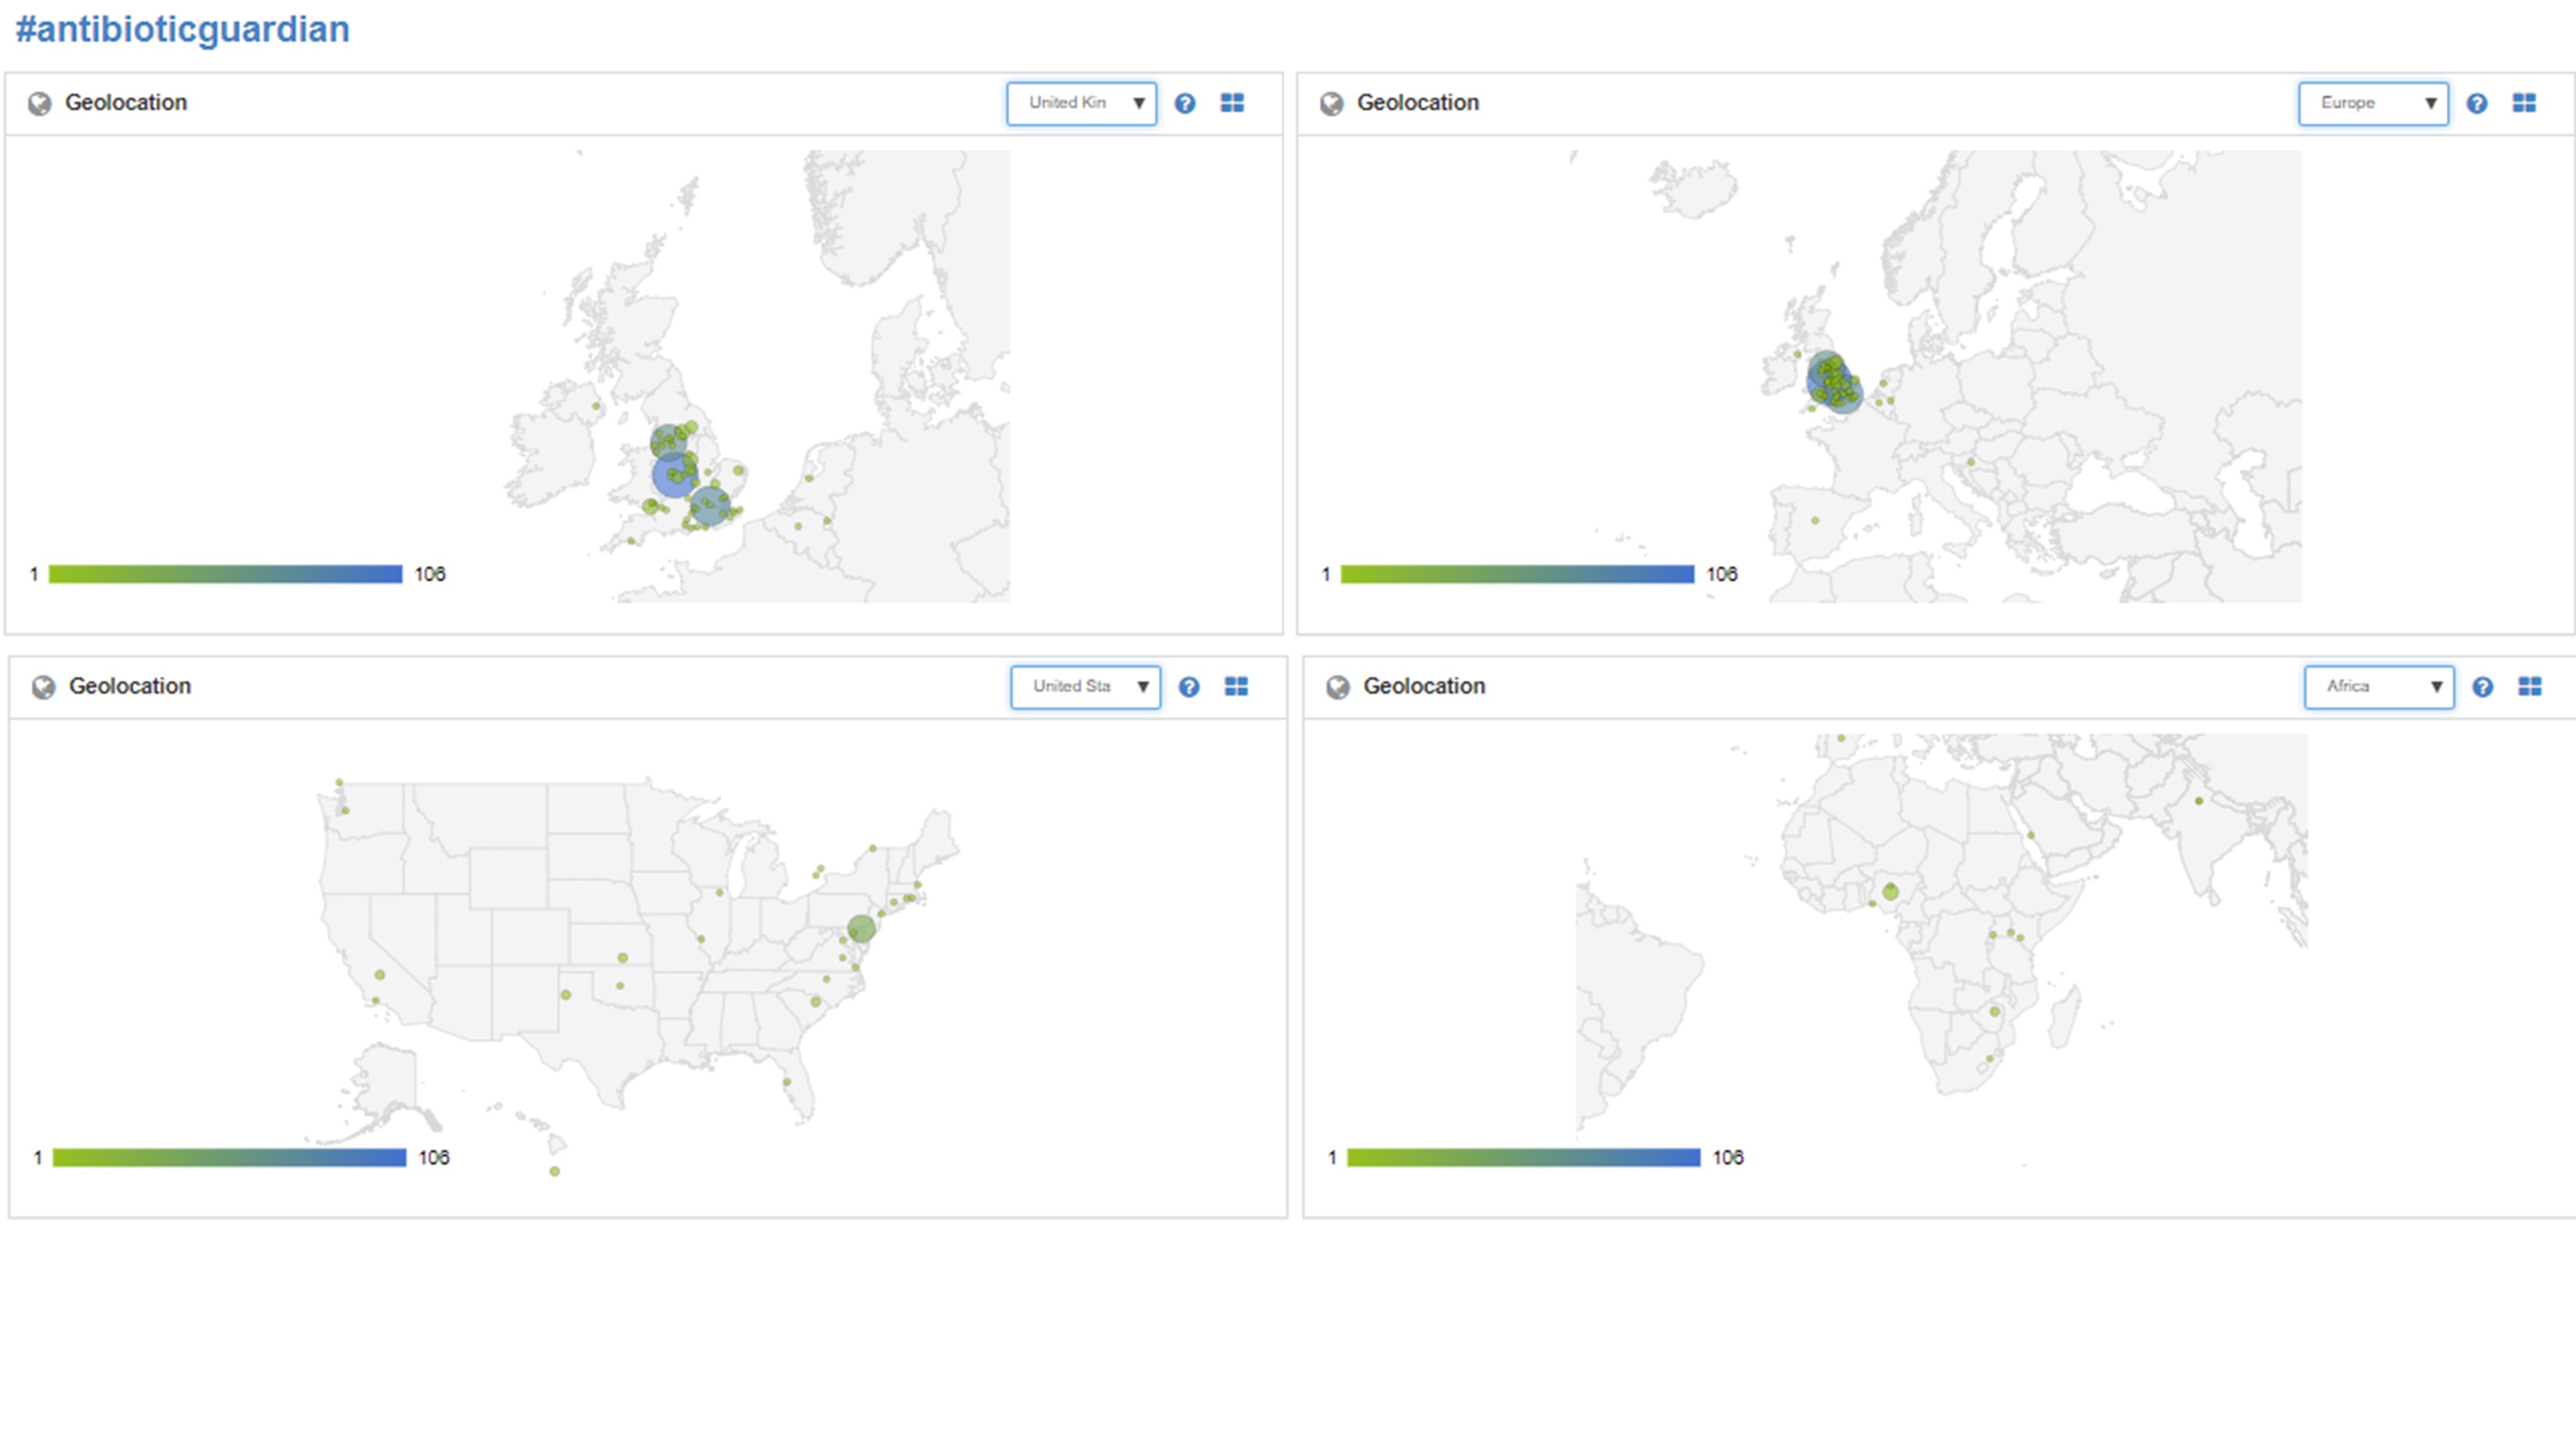 |
Click to view |
| #AntibioticResistance | 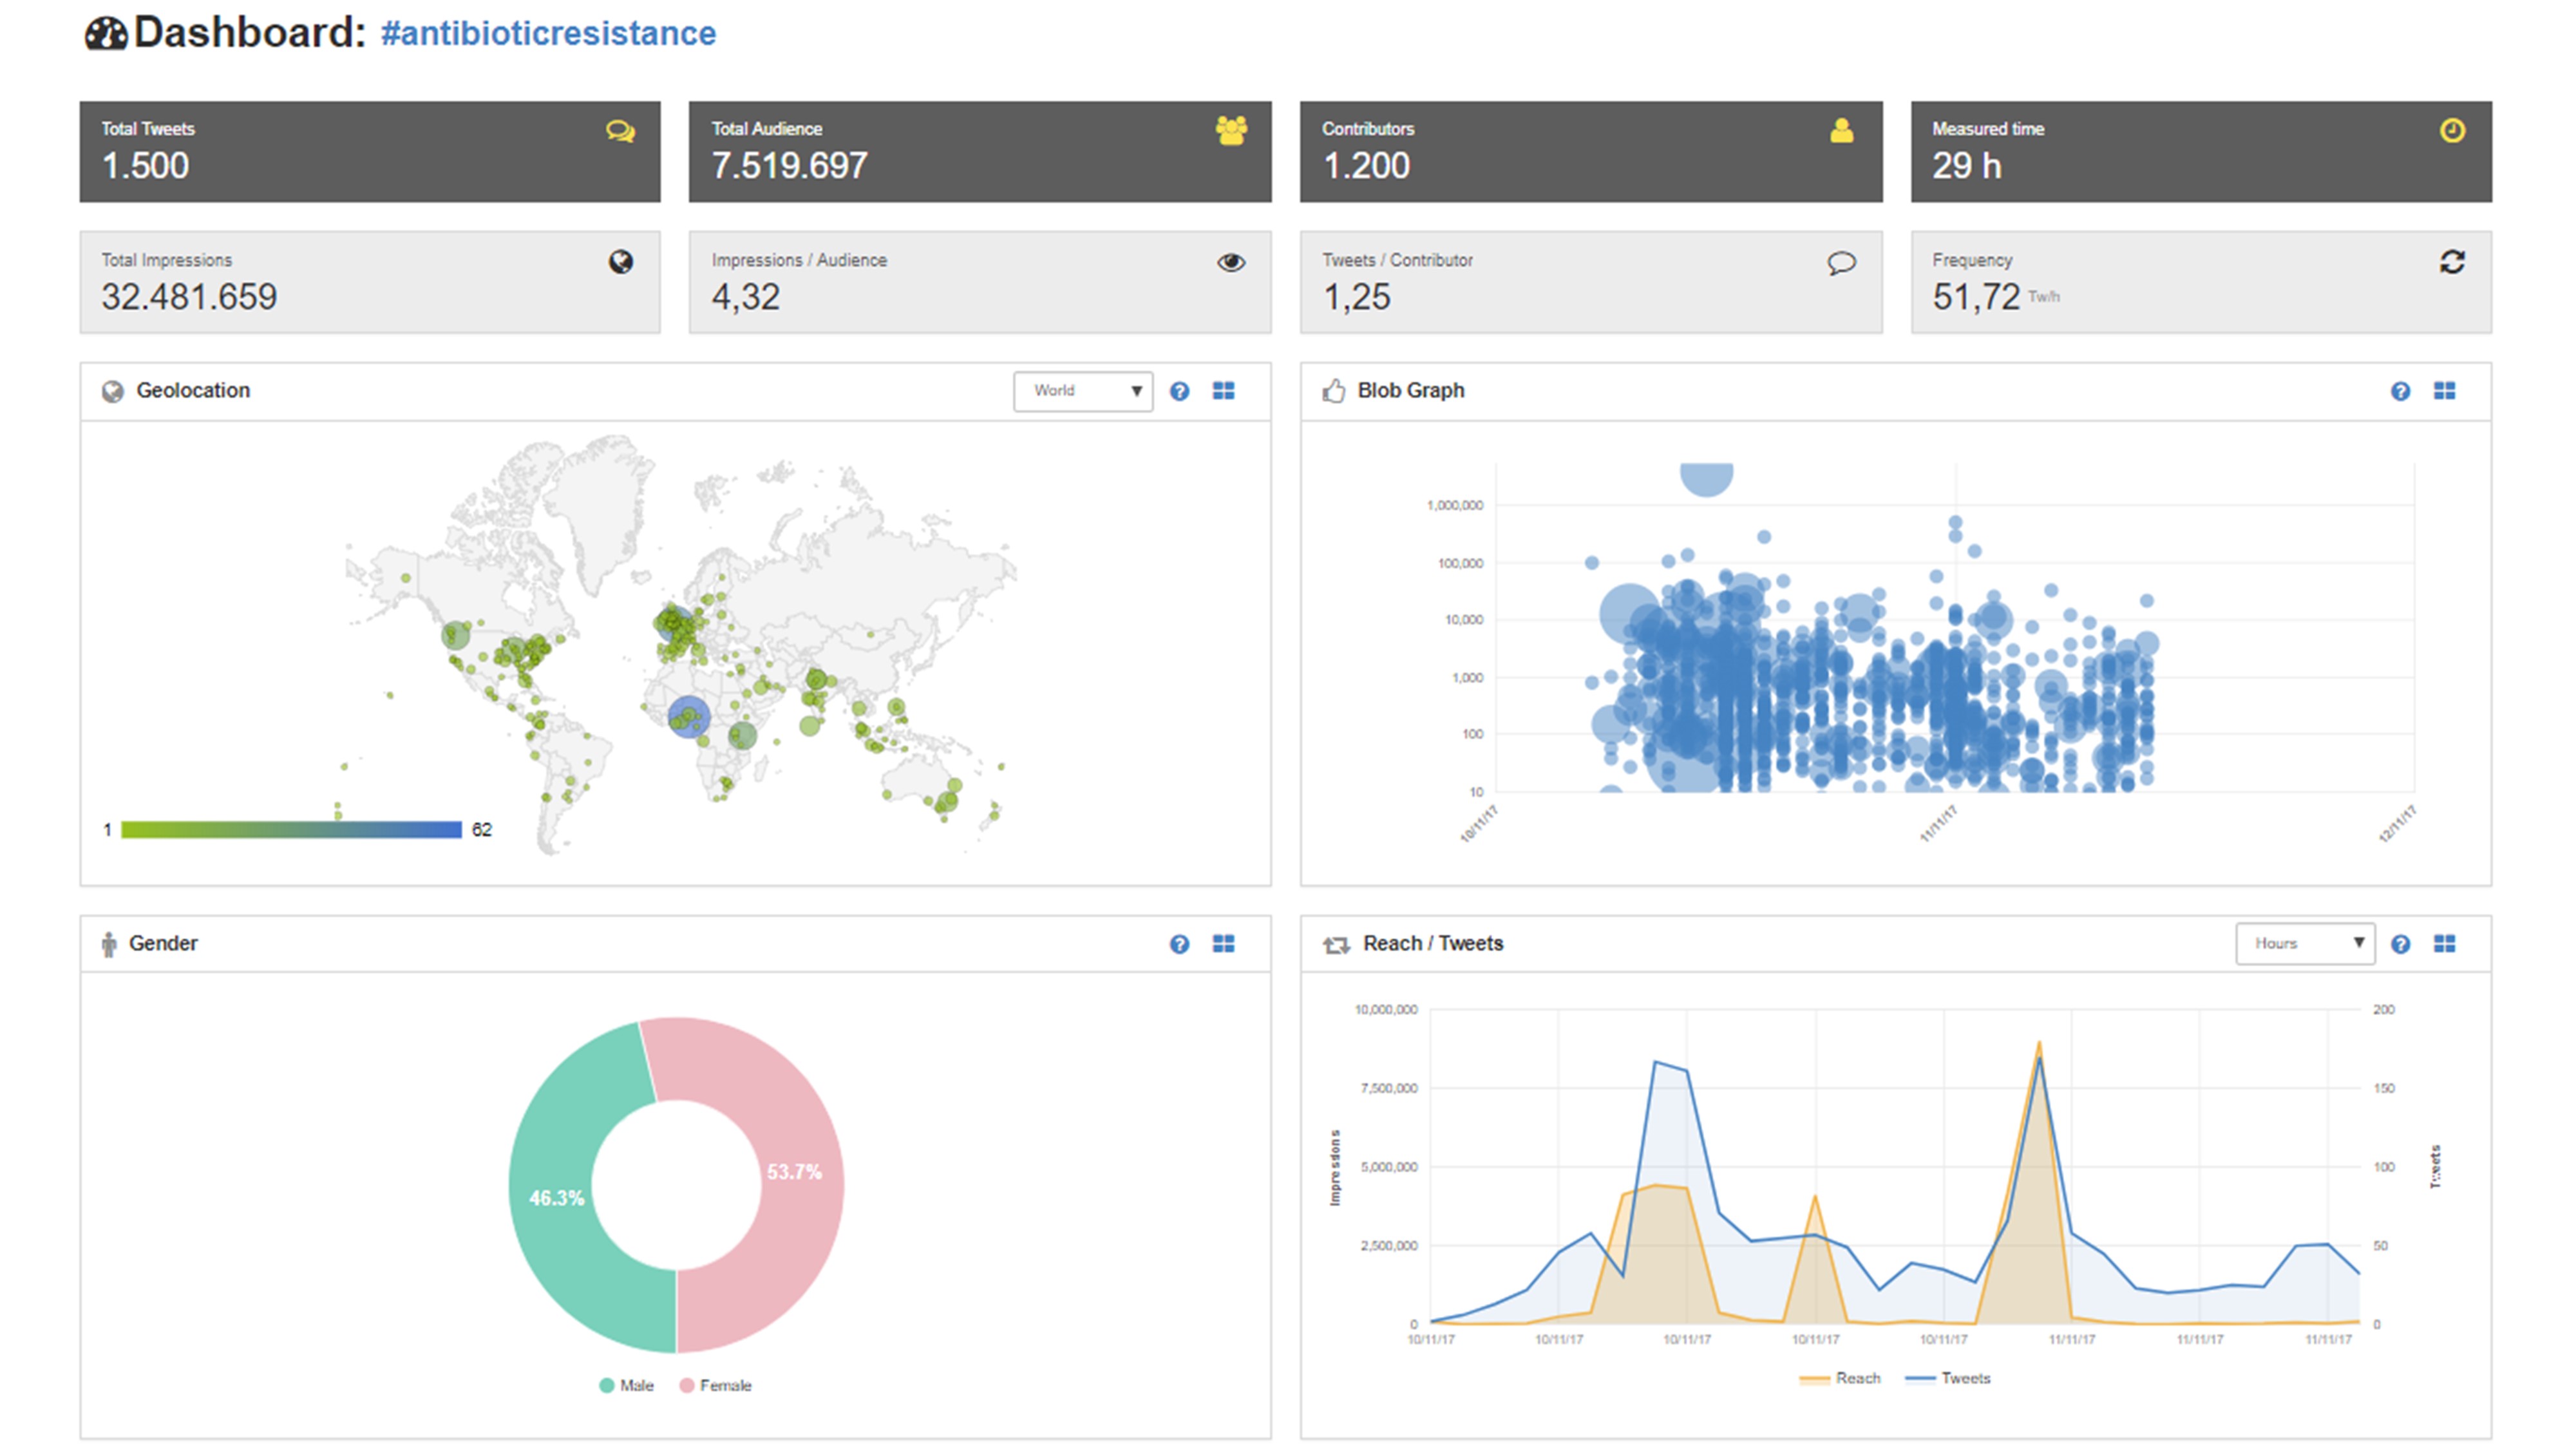 |
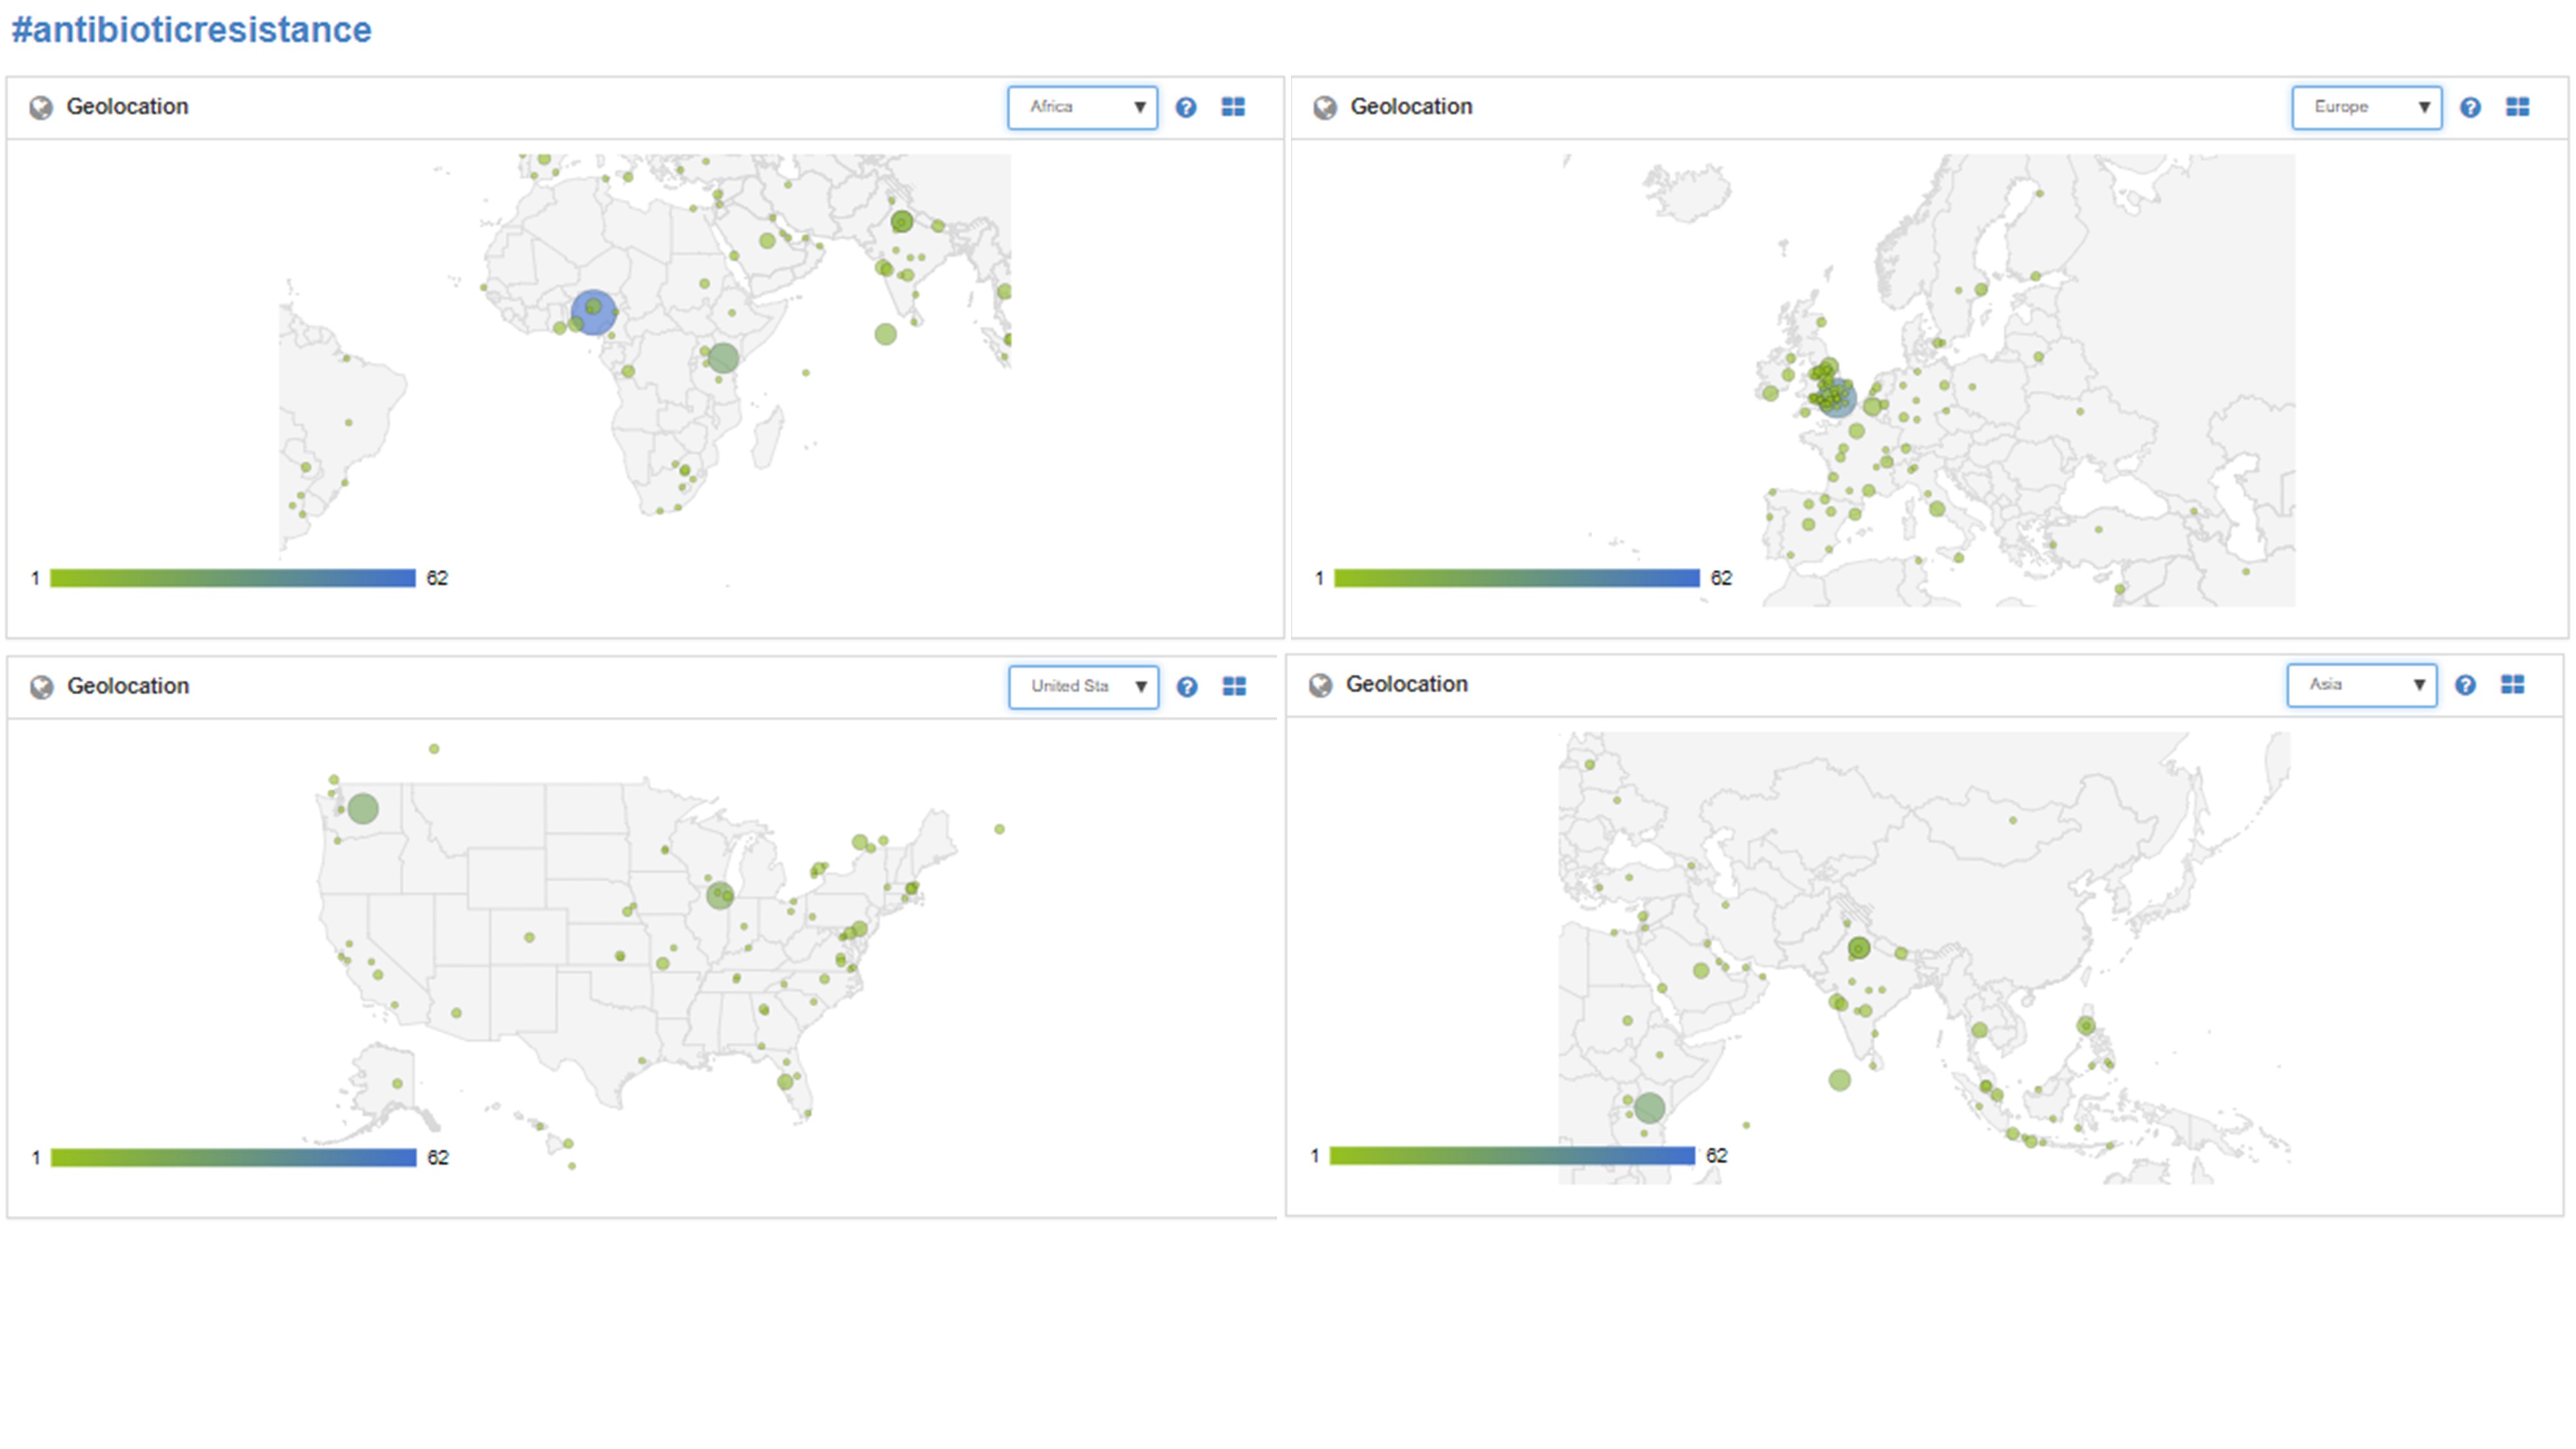 |
Click to view |
| #WAAW | 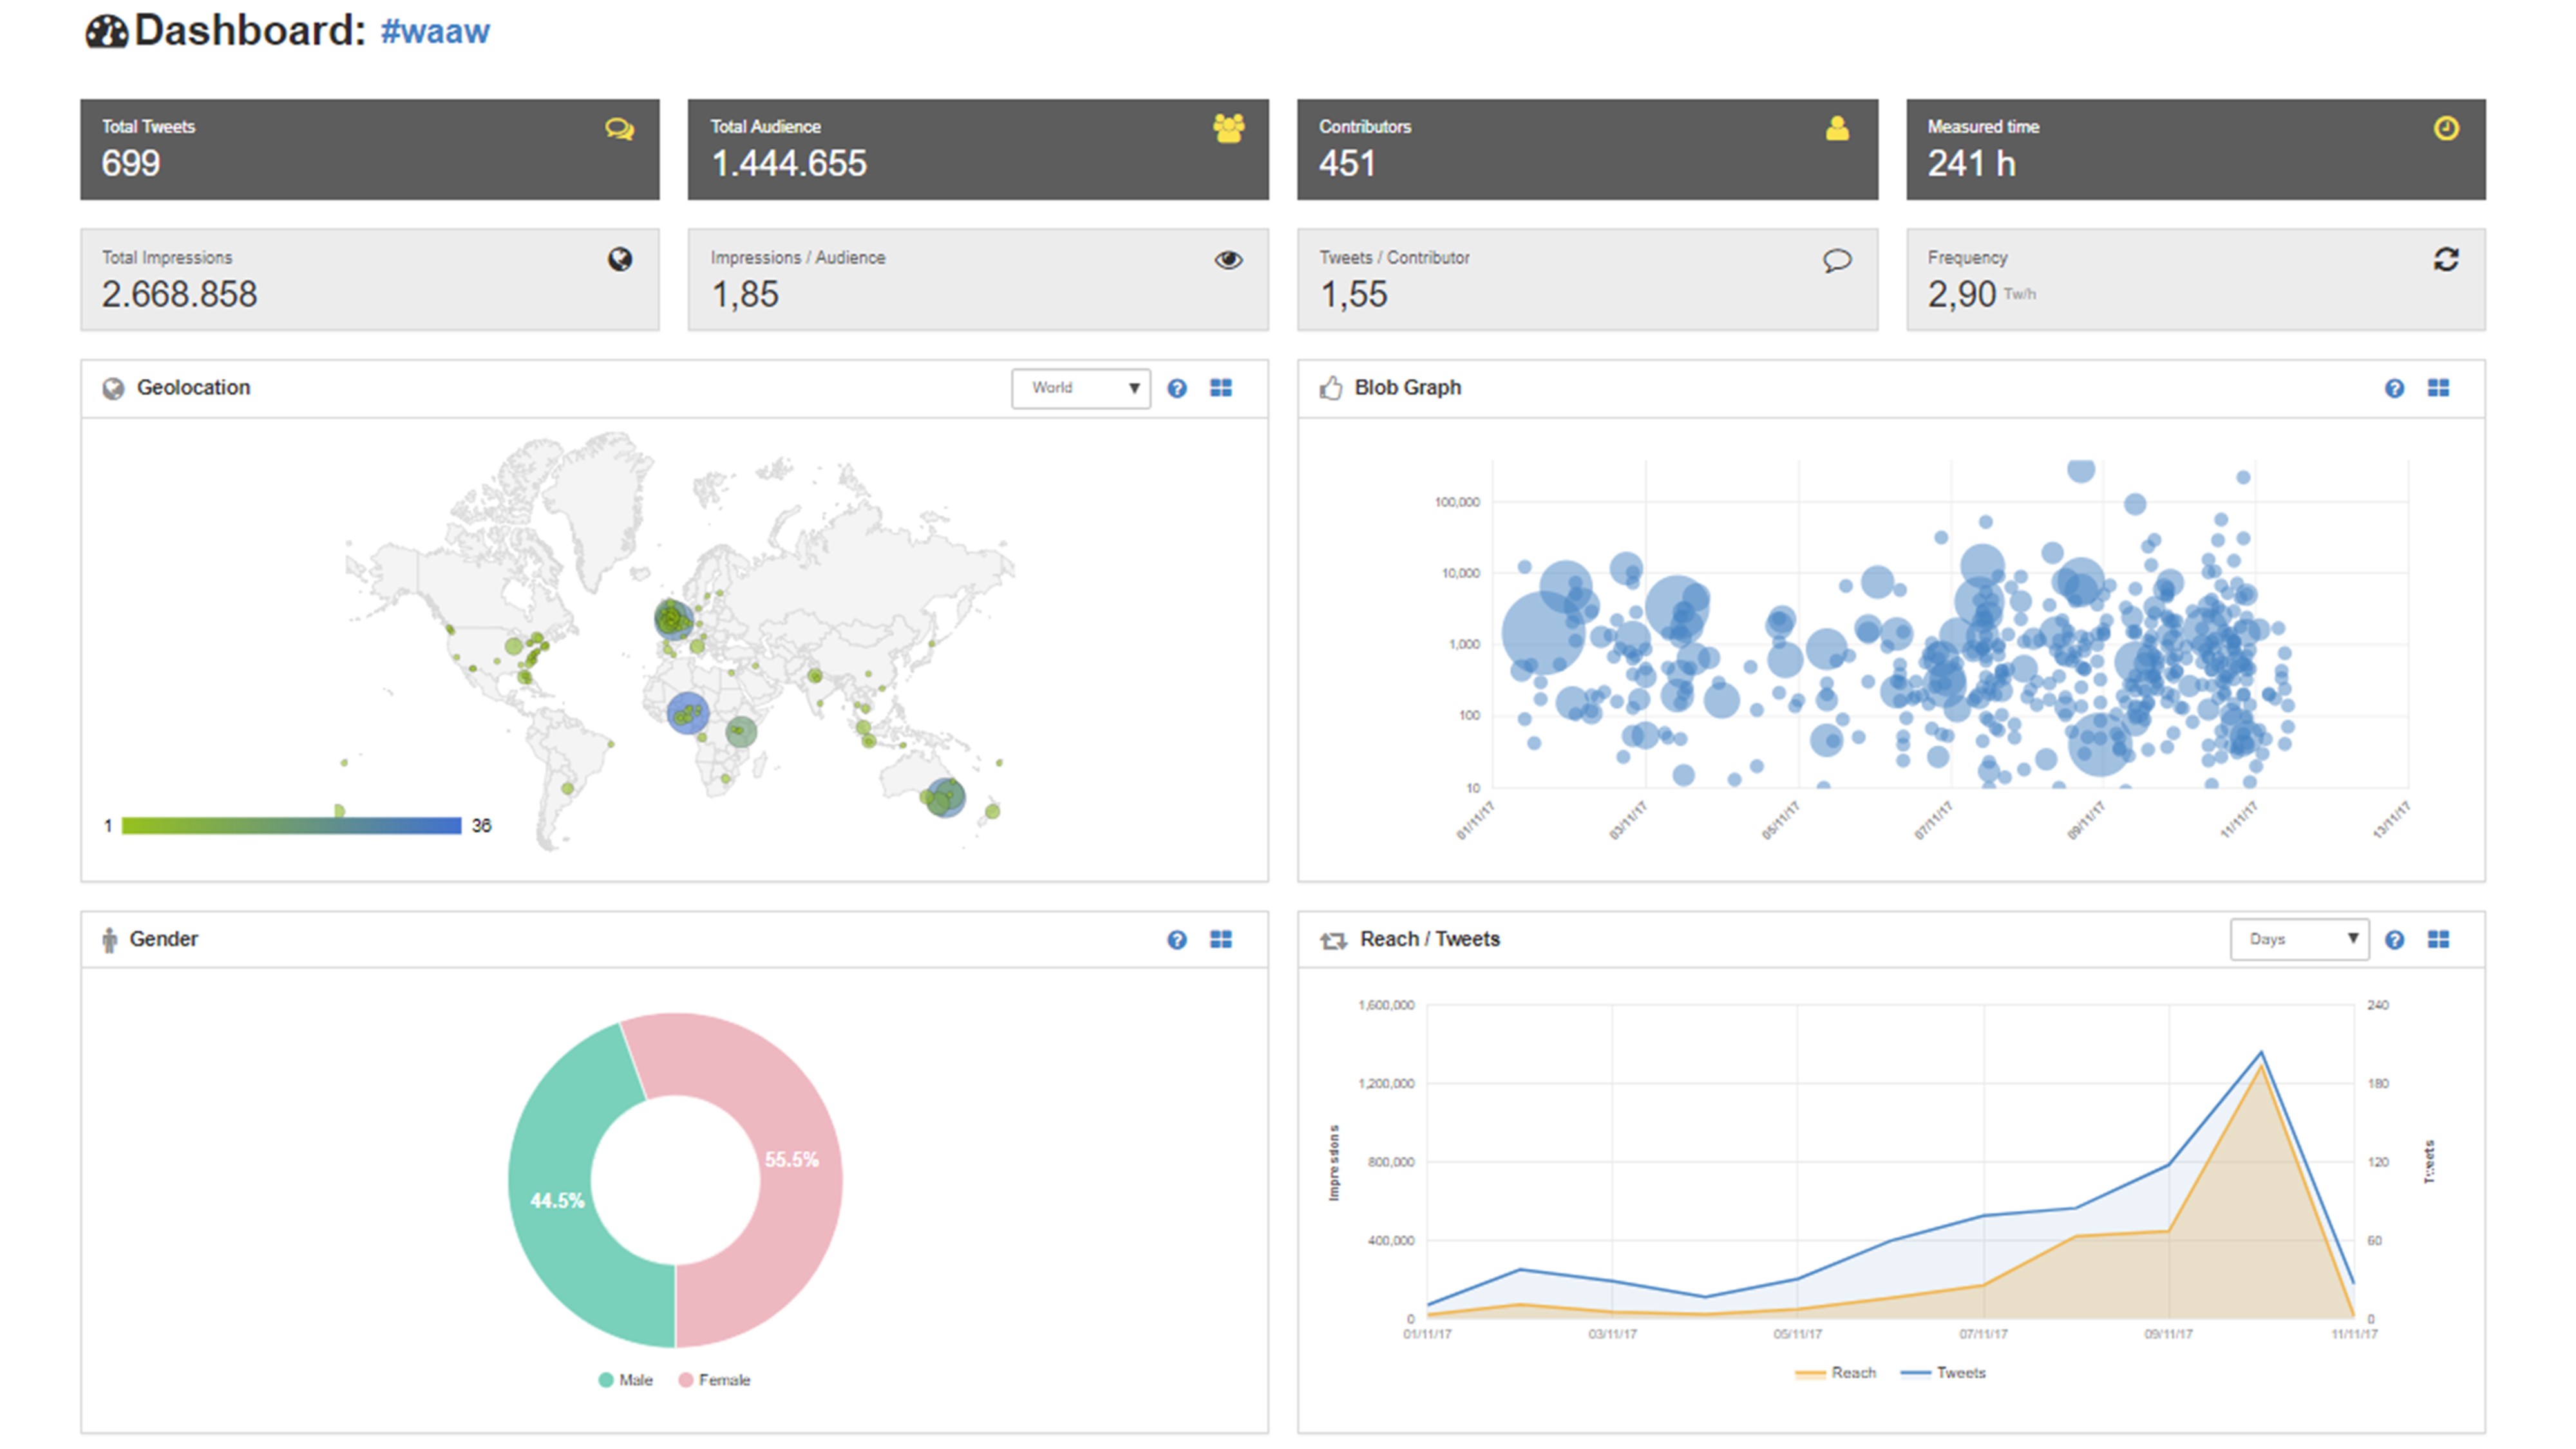 |
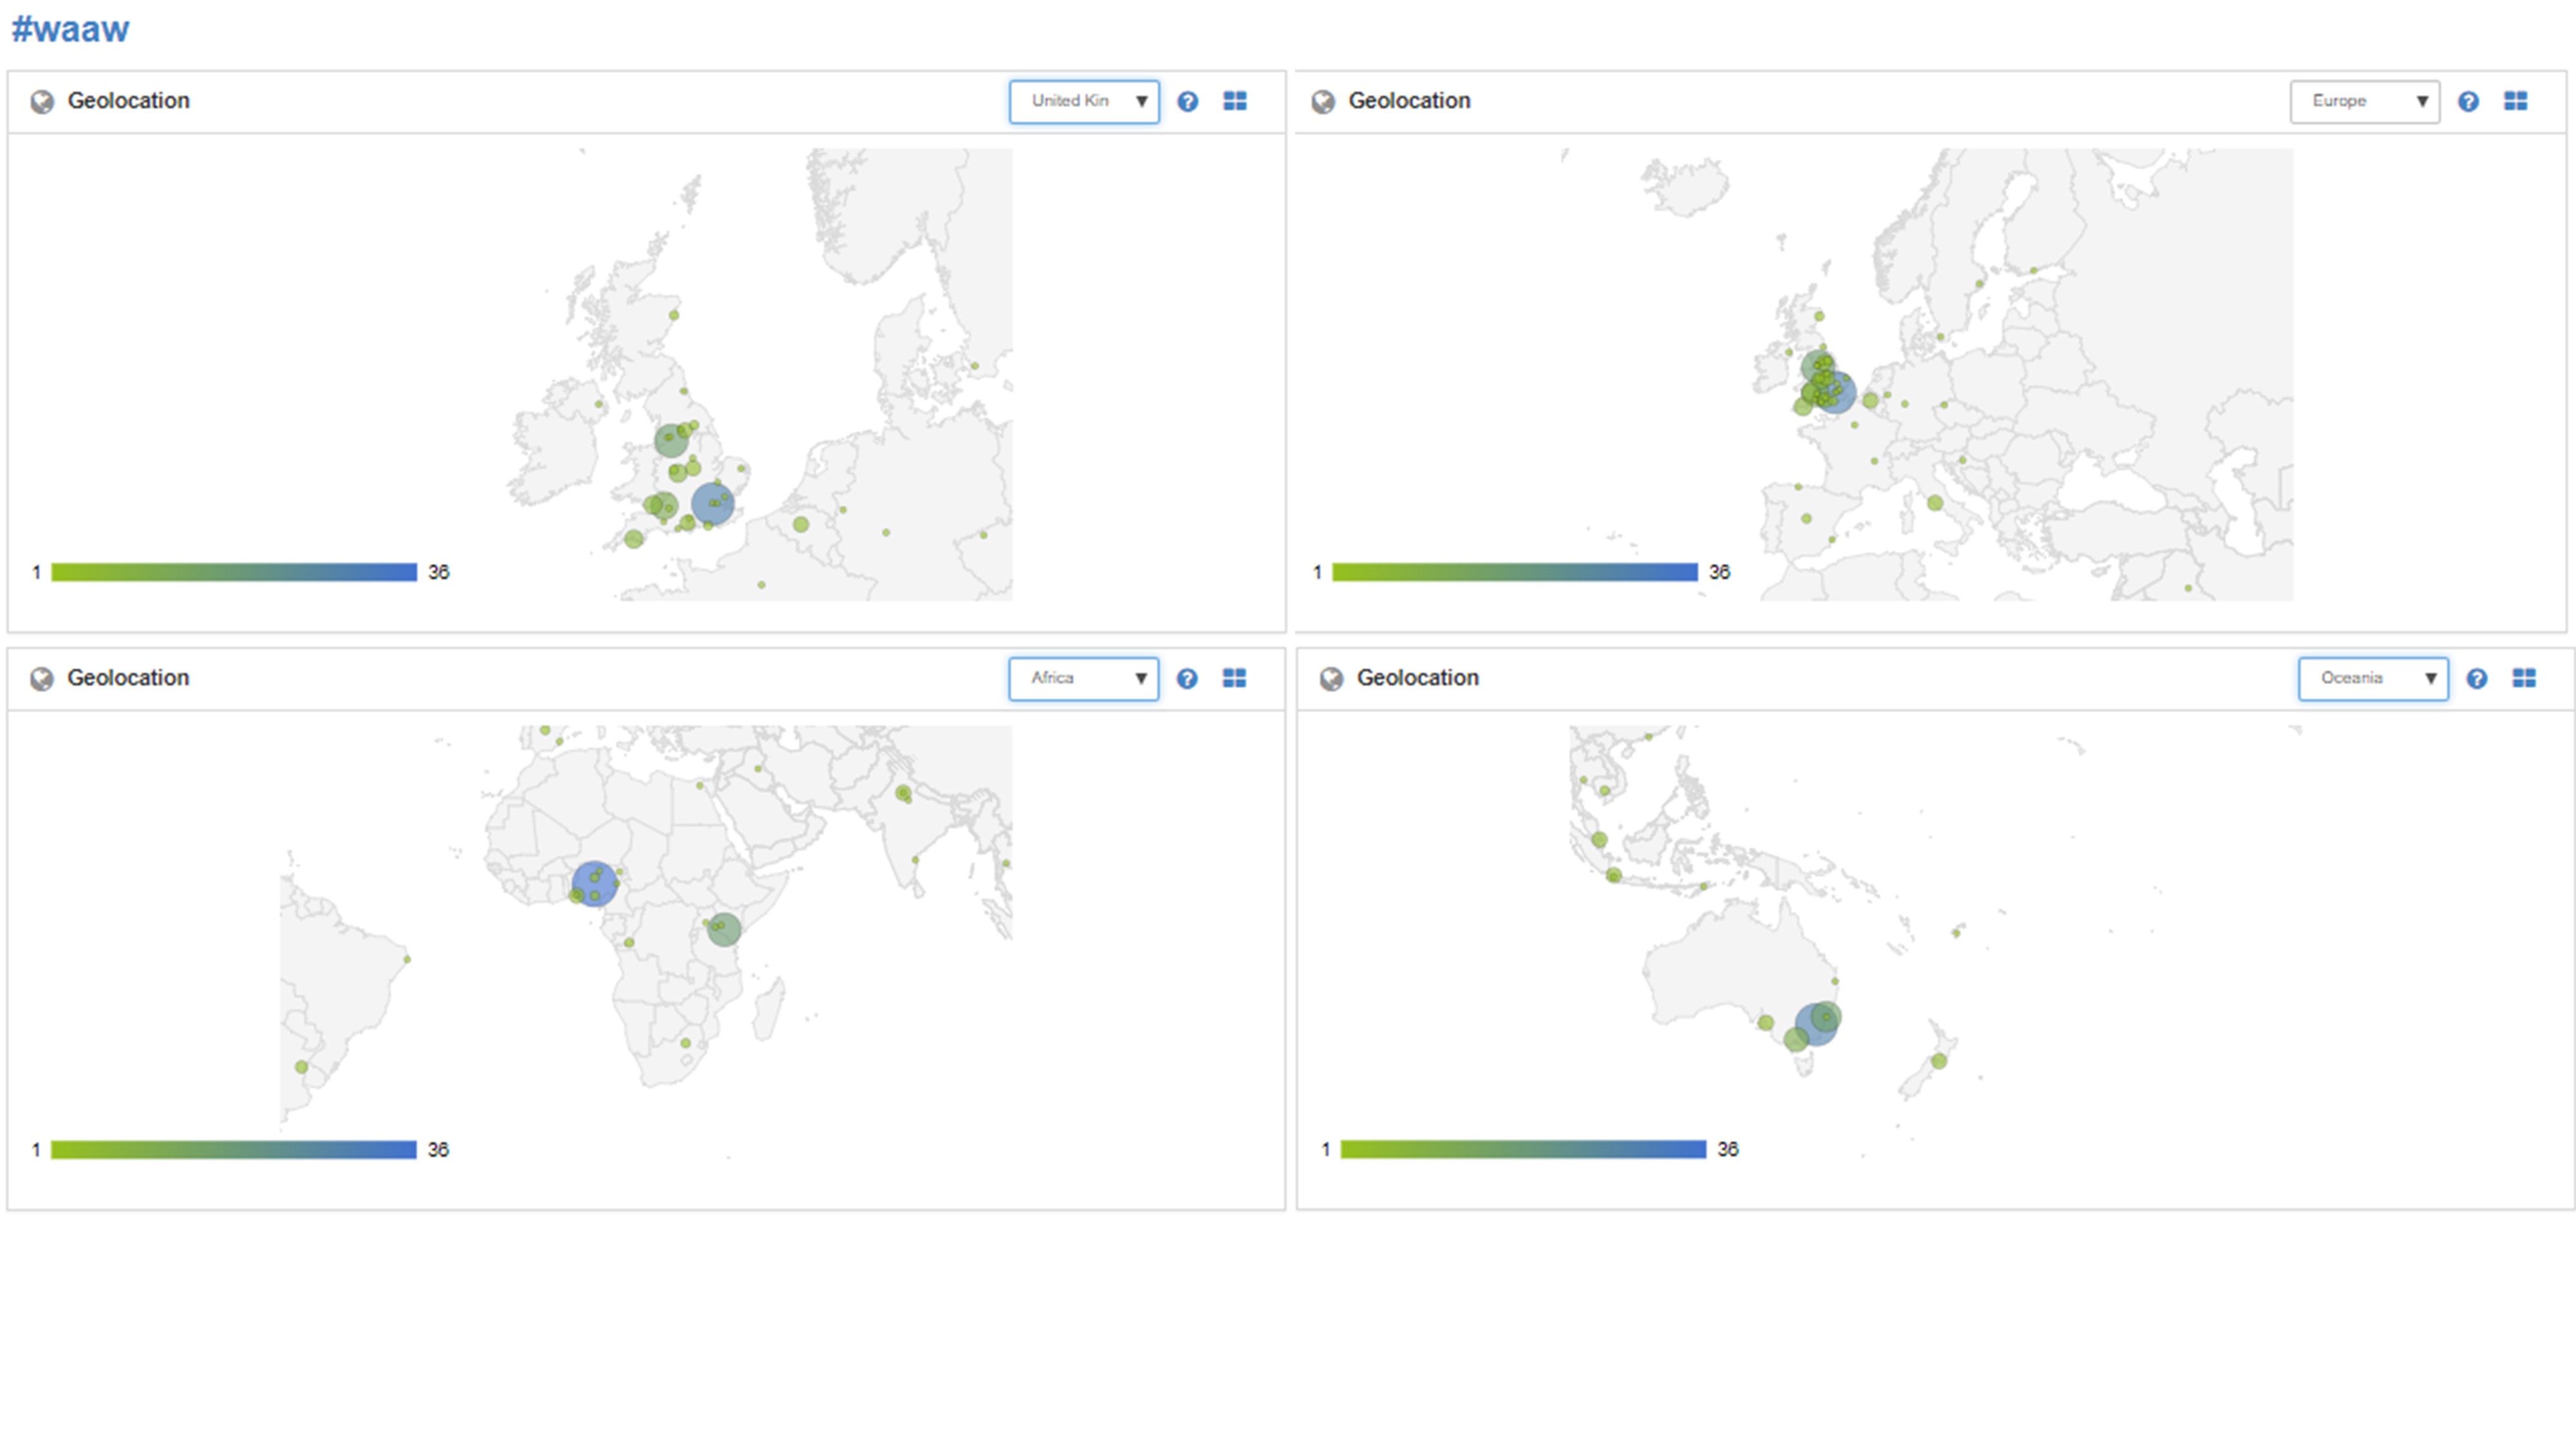 |
Click to view |
| #AntibioticAwarenessWeek | 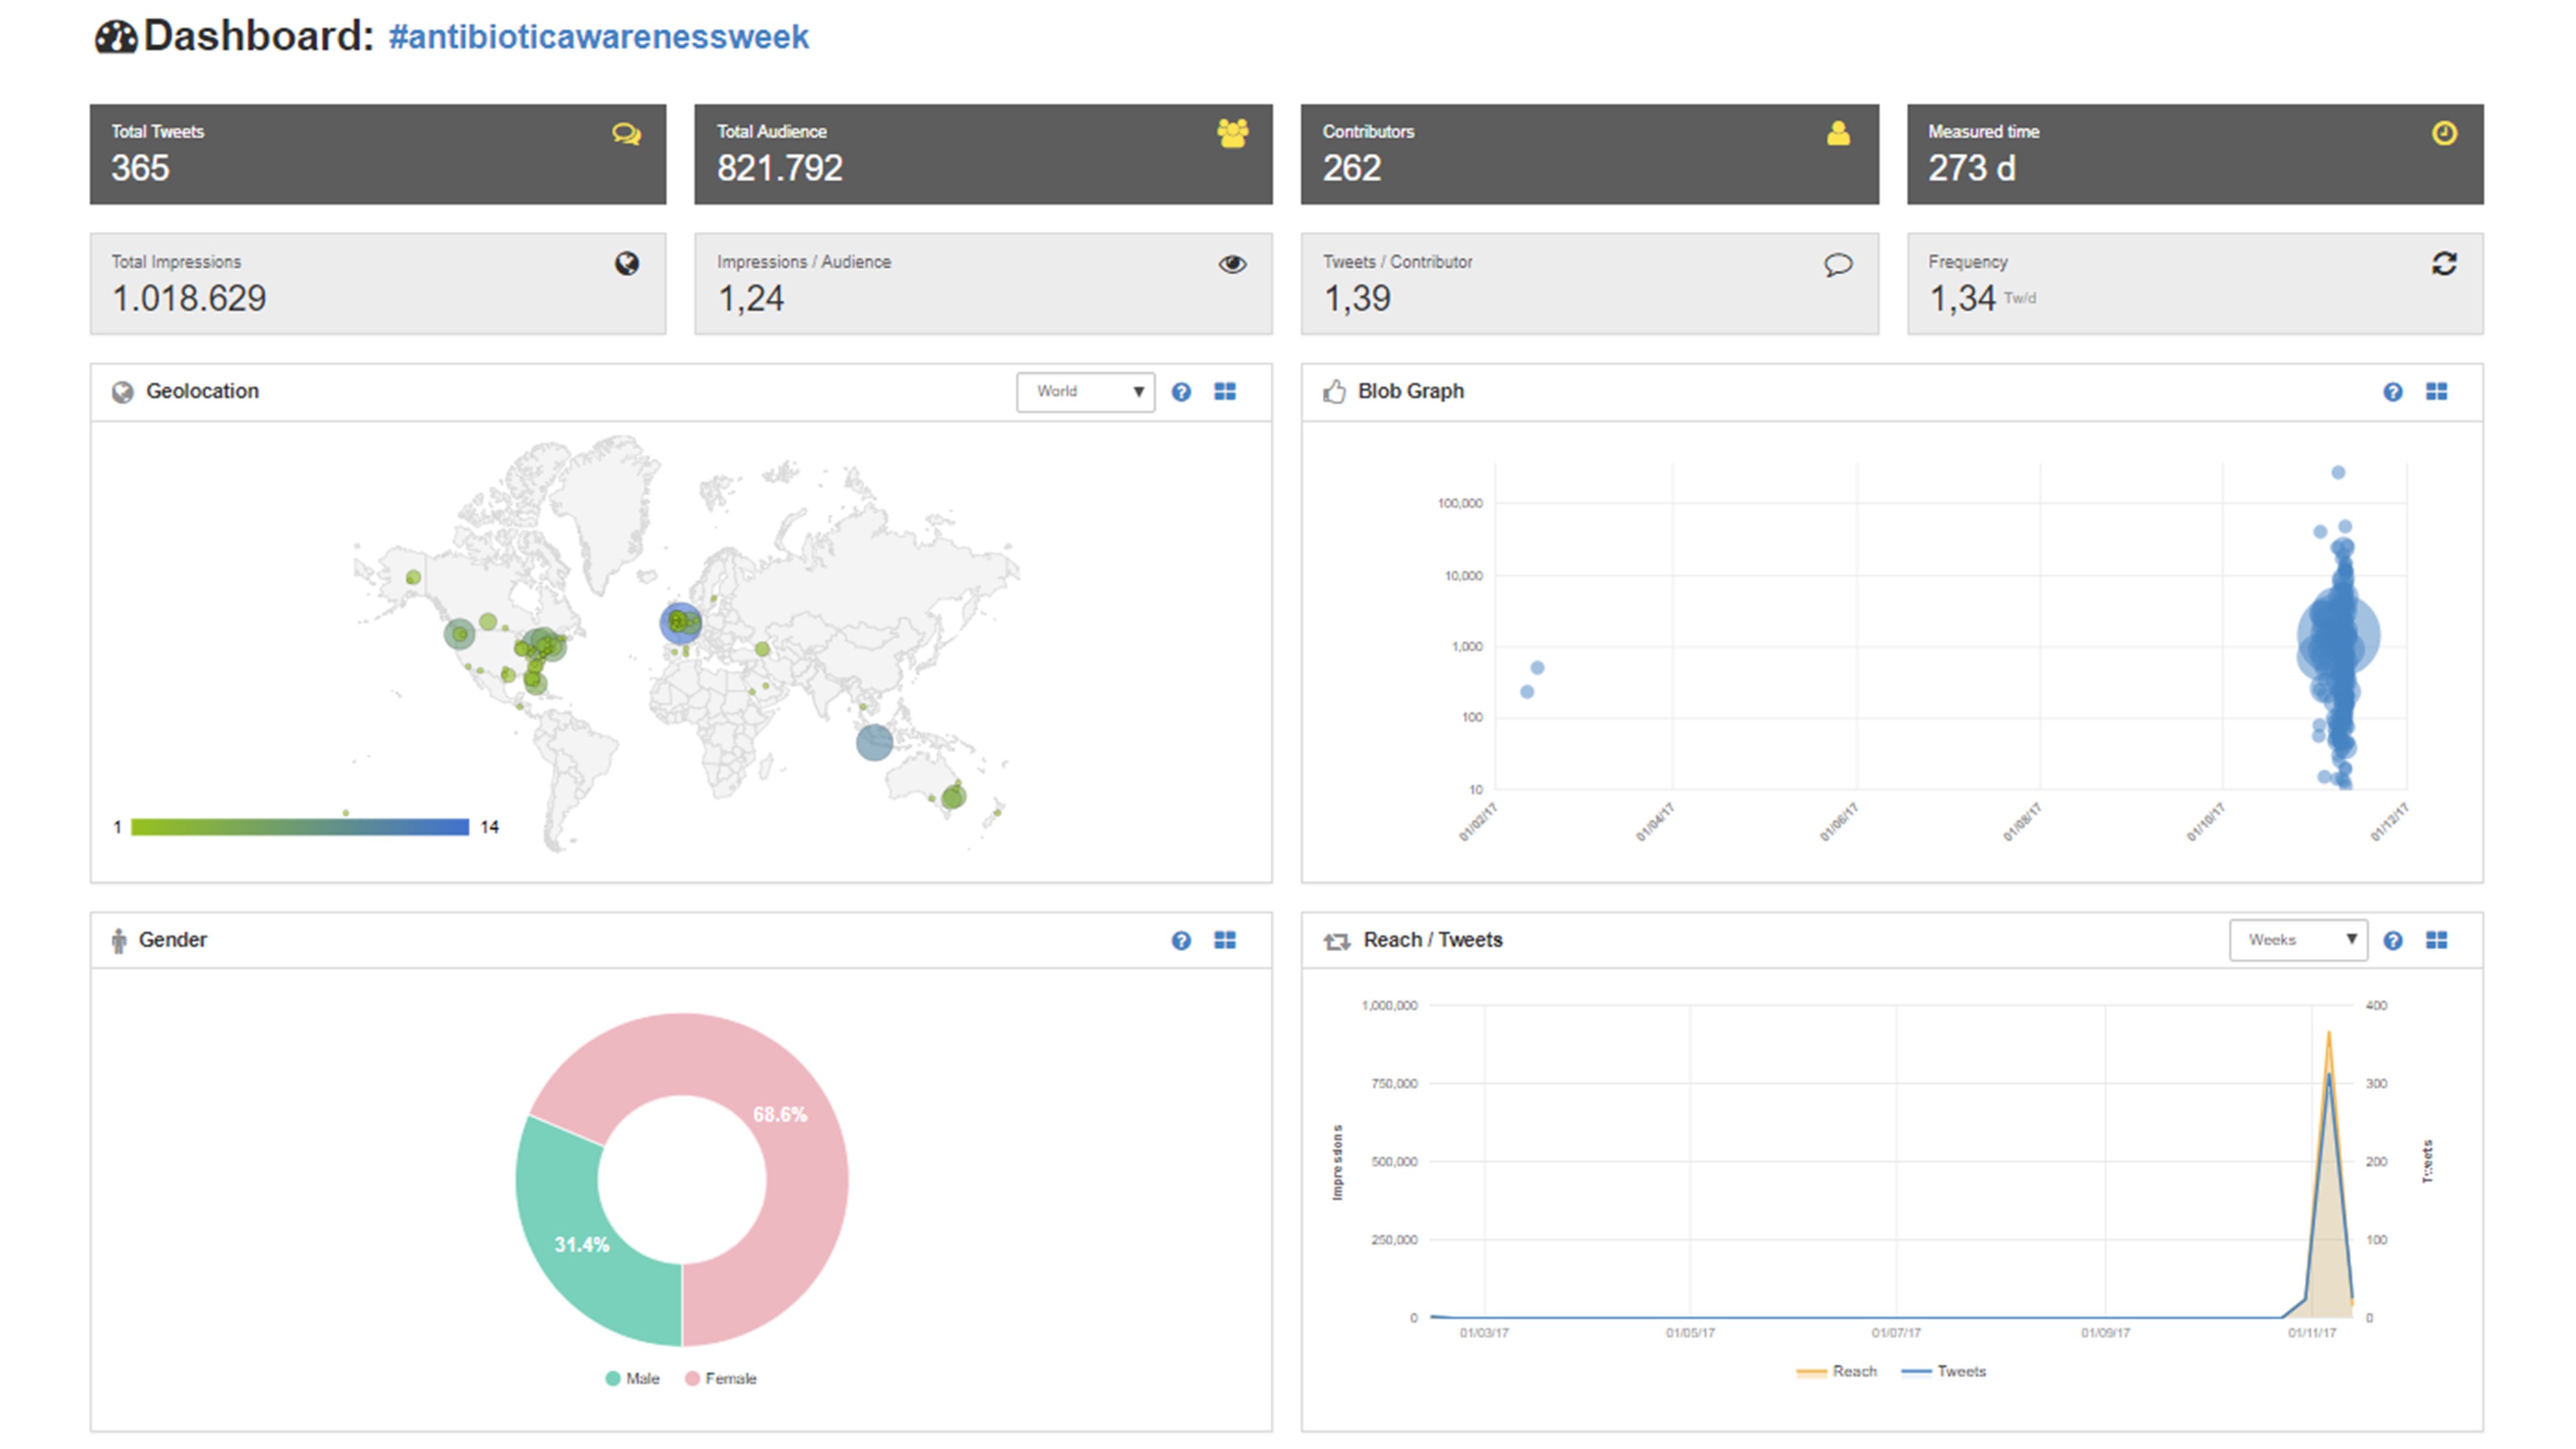 |
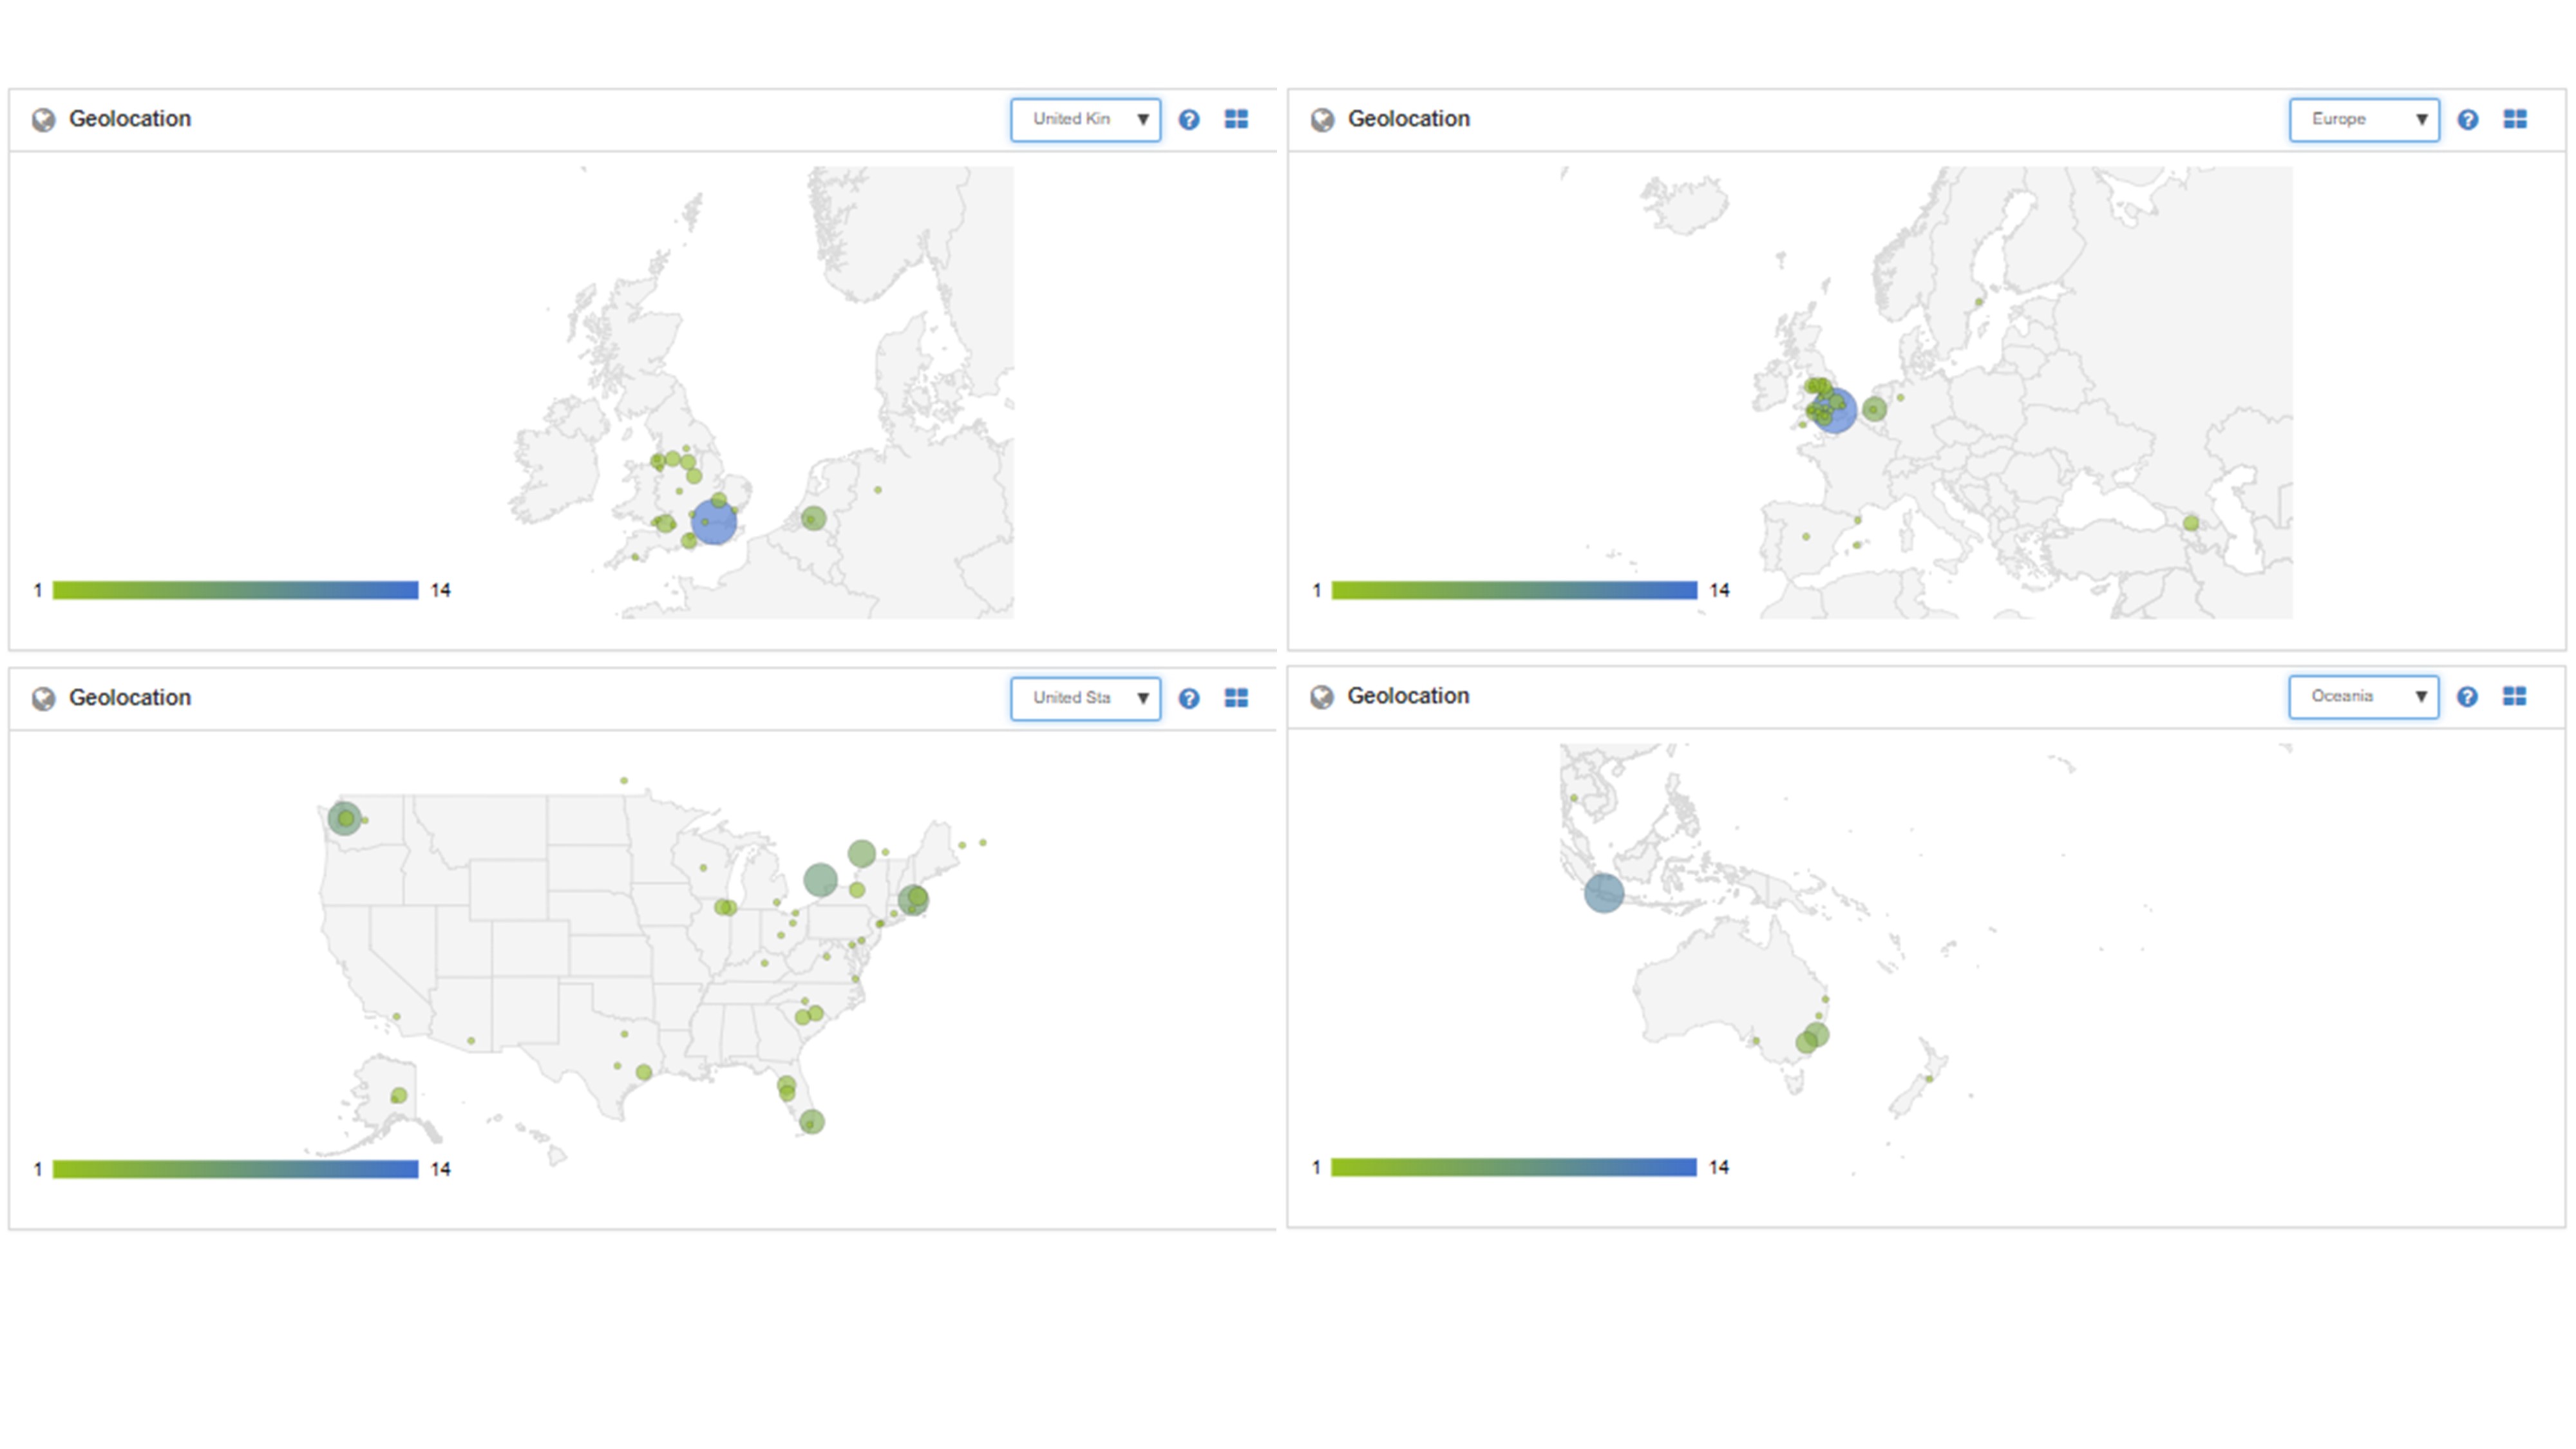 |
Click to view |
| #WAAW2017 | 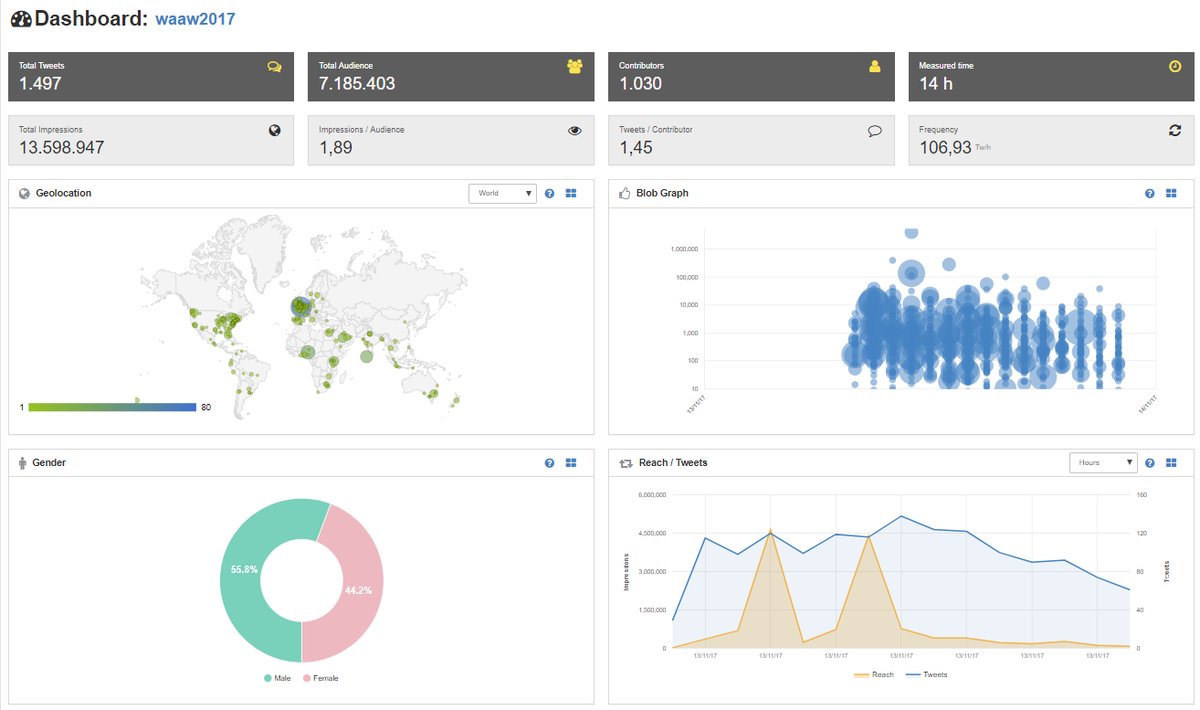 |
This was added after observing tweets on day 1 of campaign (13 Nov) | Click to view |
| #WAAW17 | 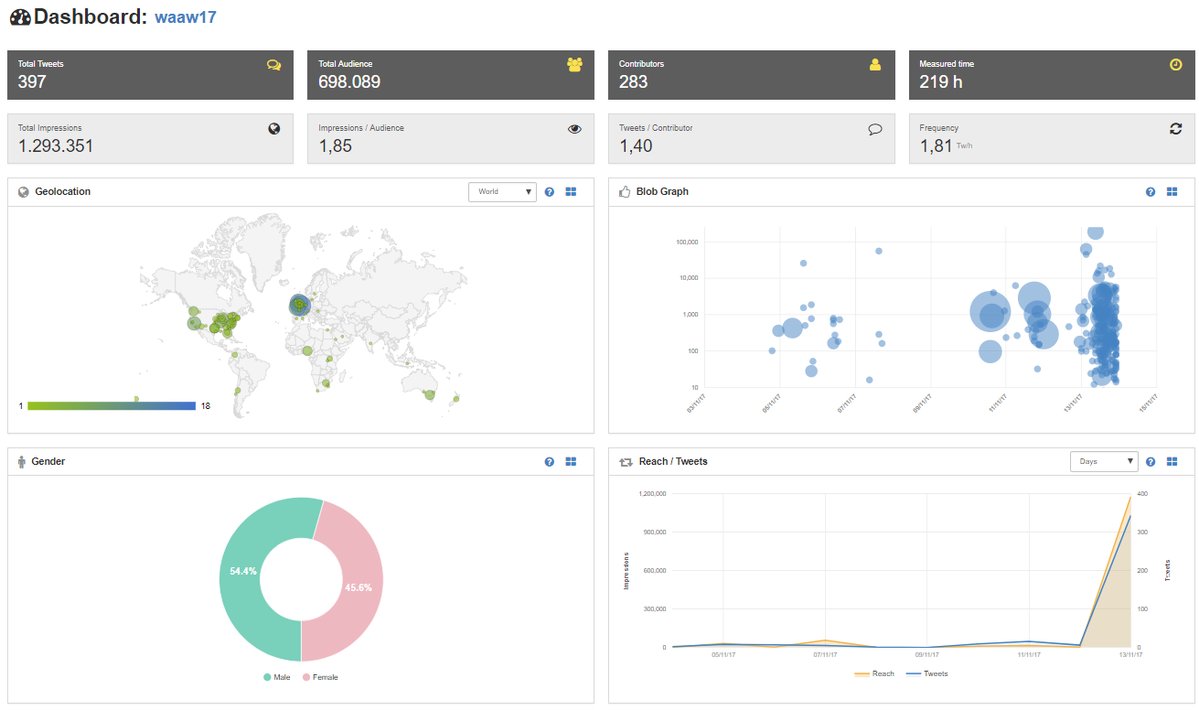 |
This was added after observing tweets on day 1 of campaign (13 Nov) | Click to view |
| #AAW2017 | 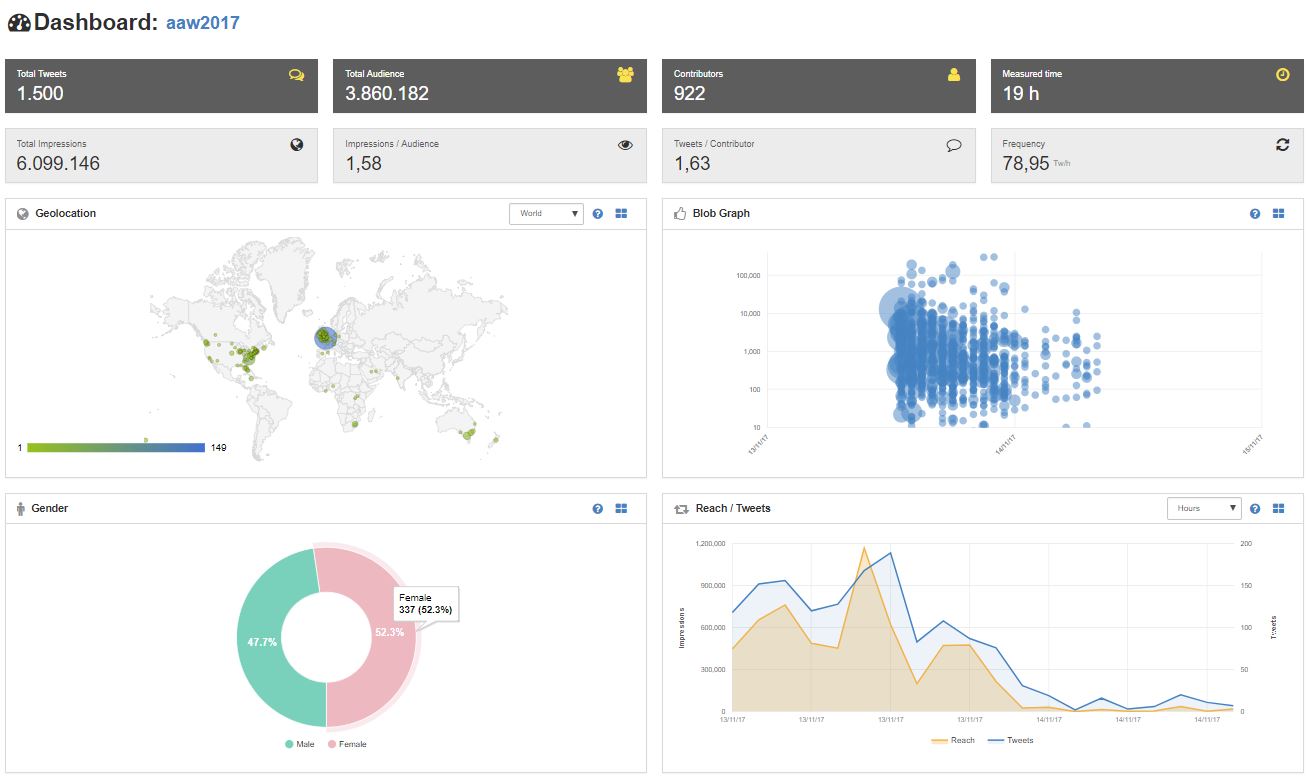 |
This was added after observing tweets on day 1 of campaign (13 Nov) | Click to view |
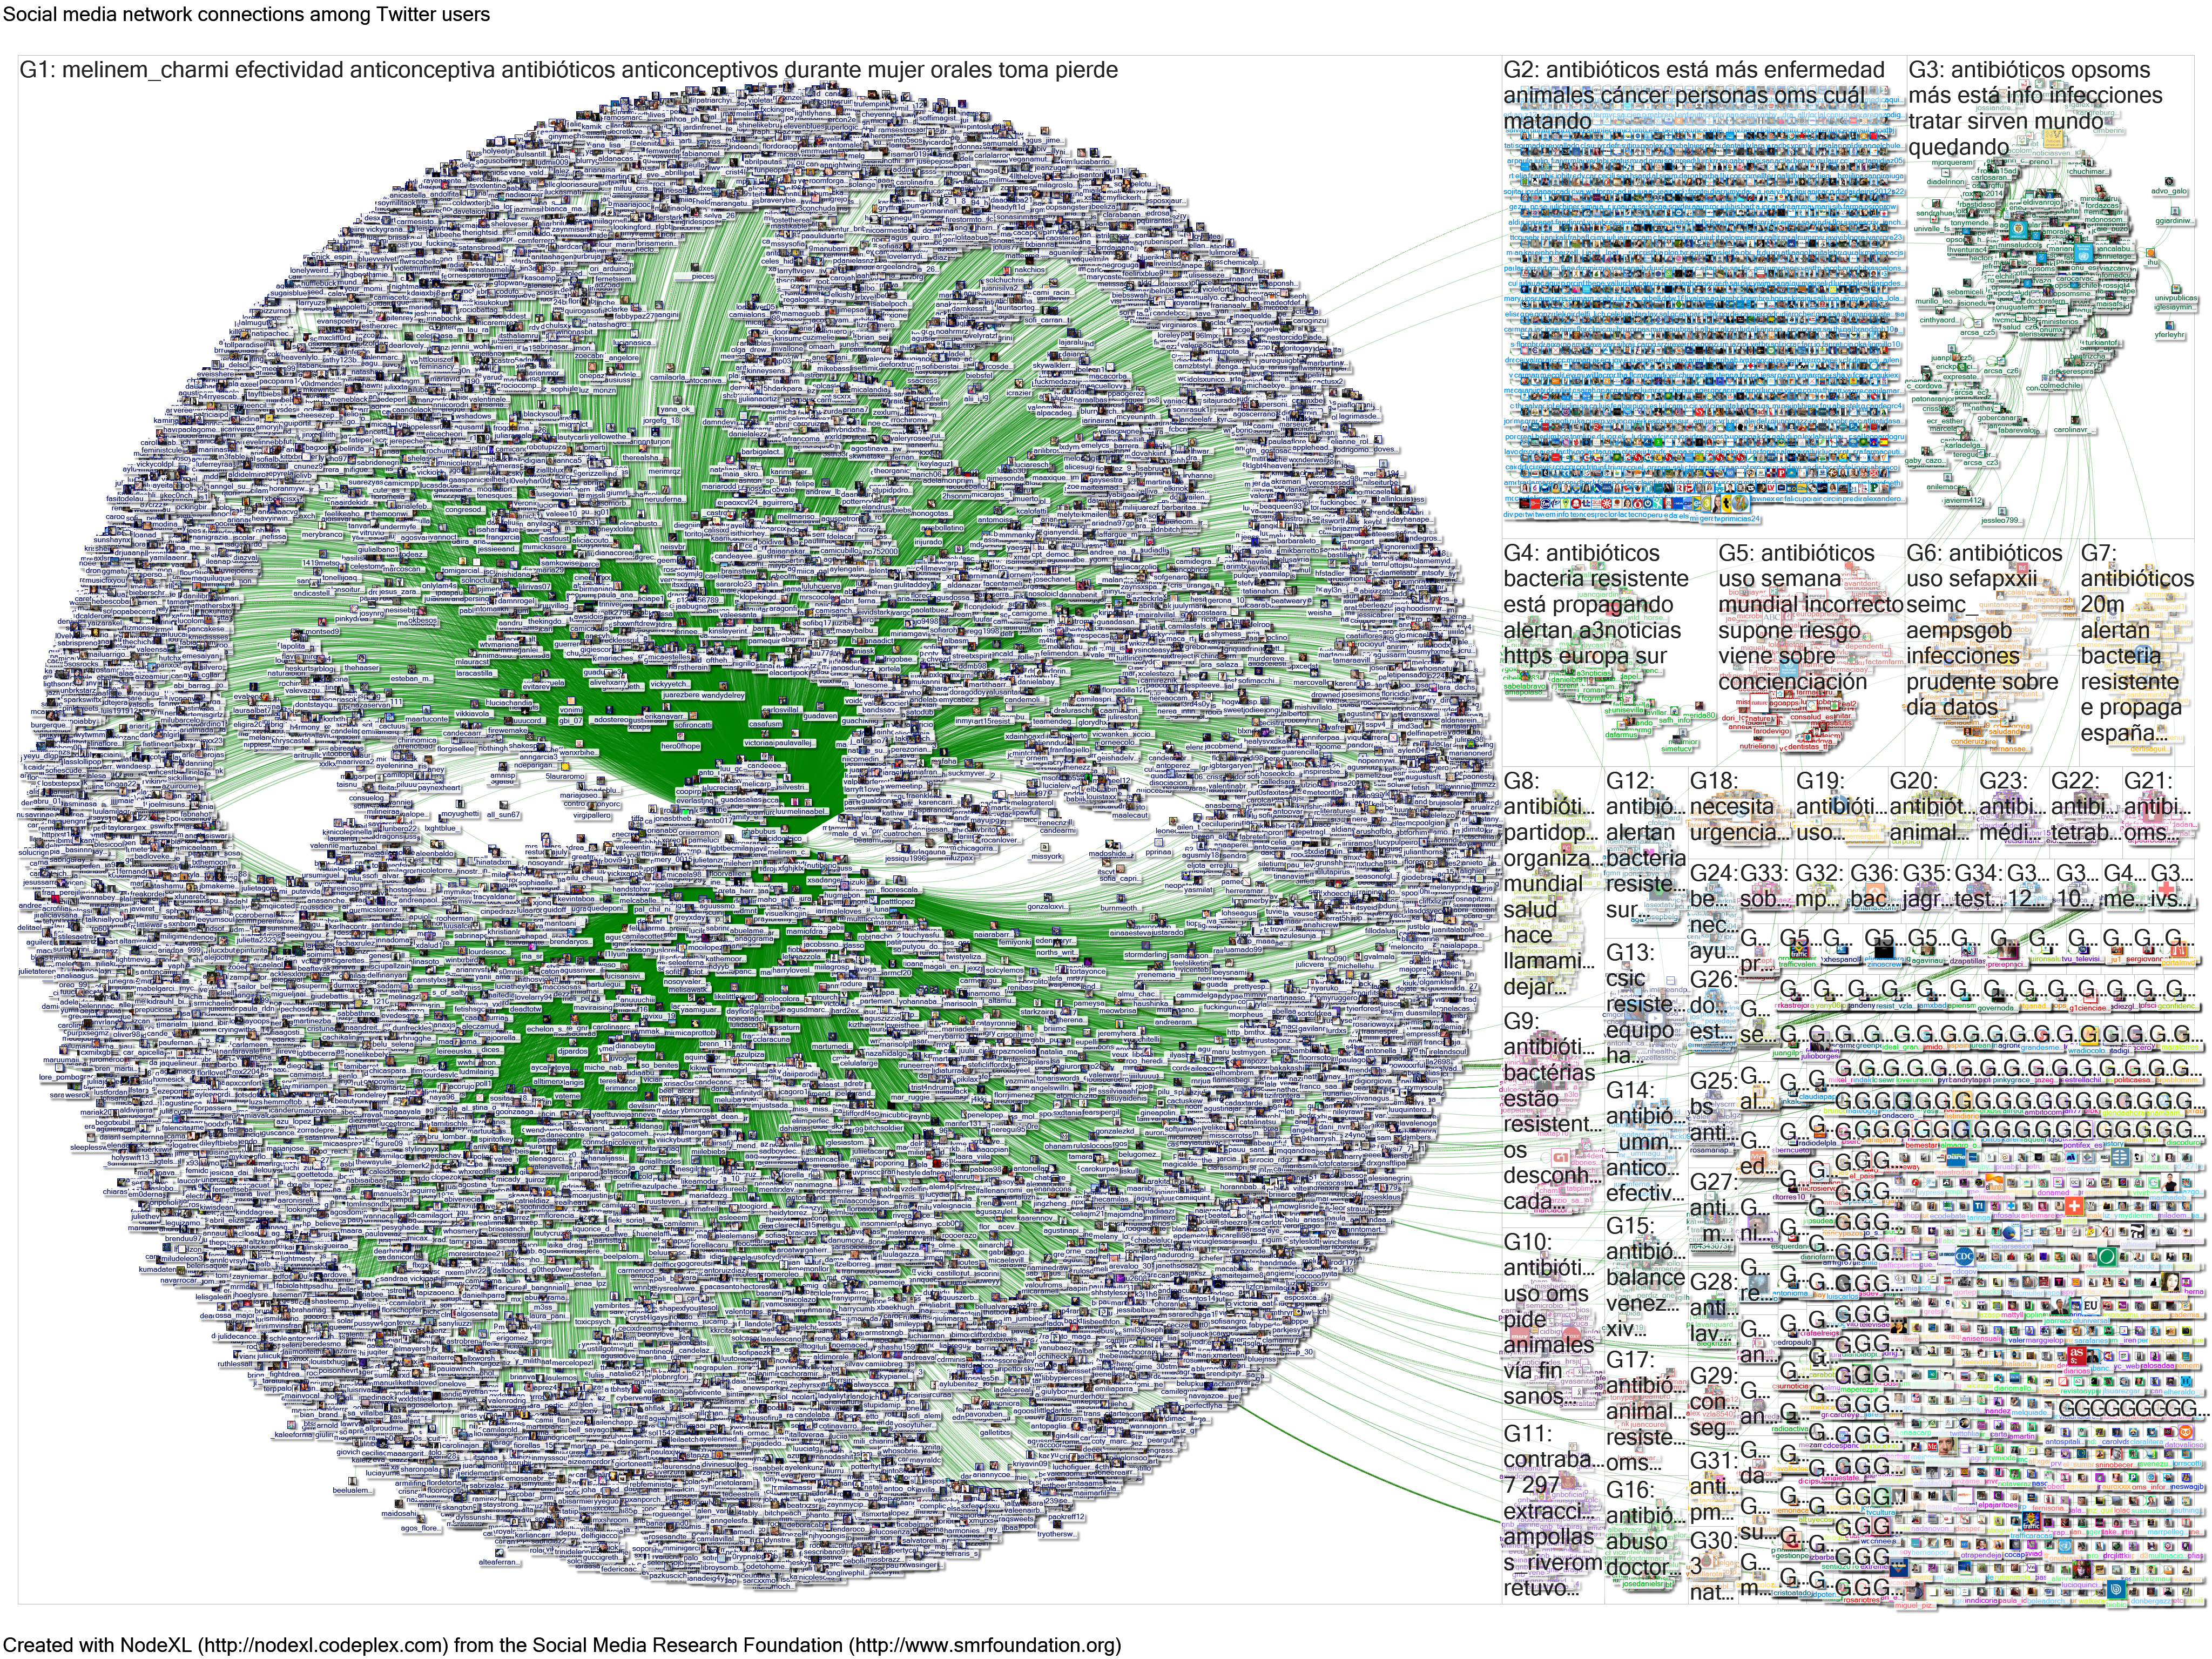
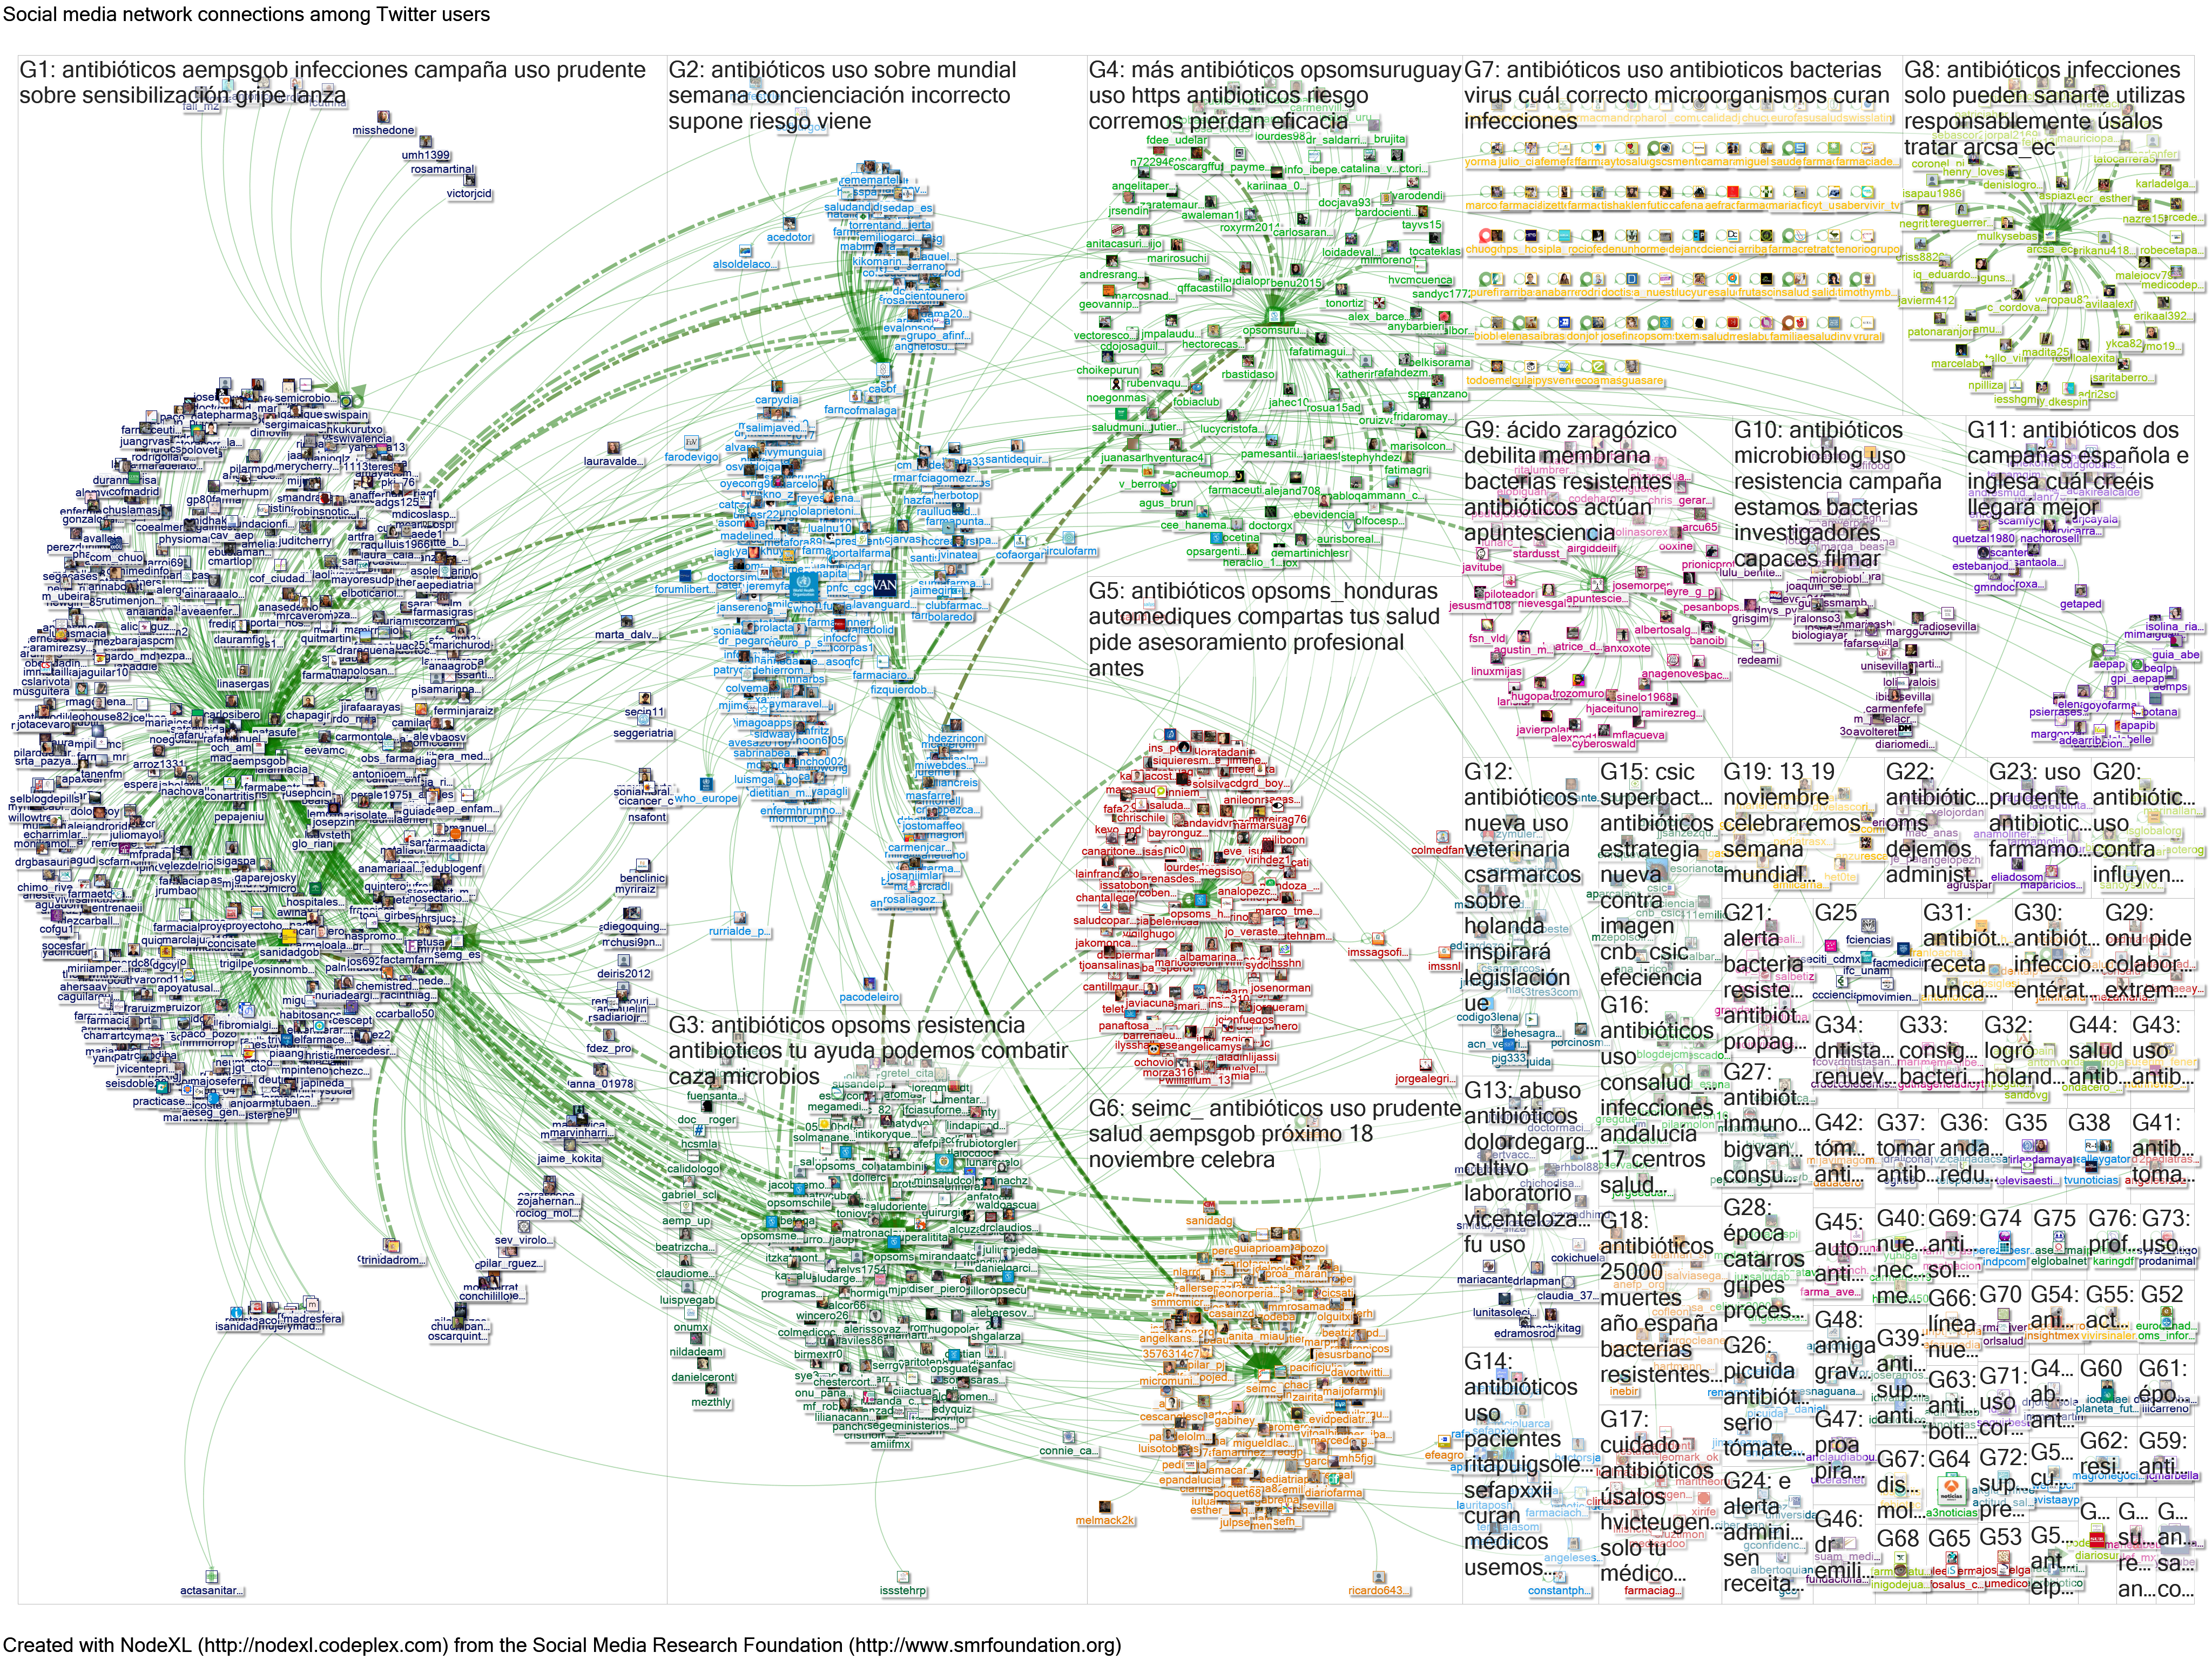
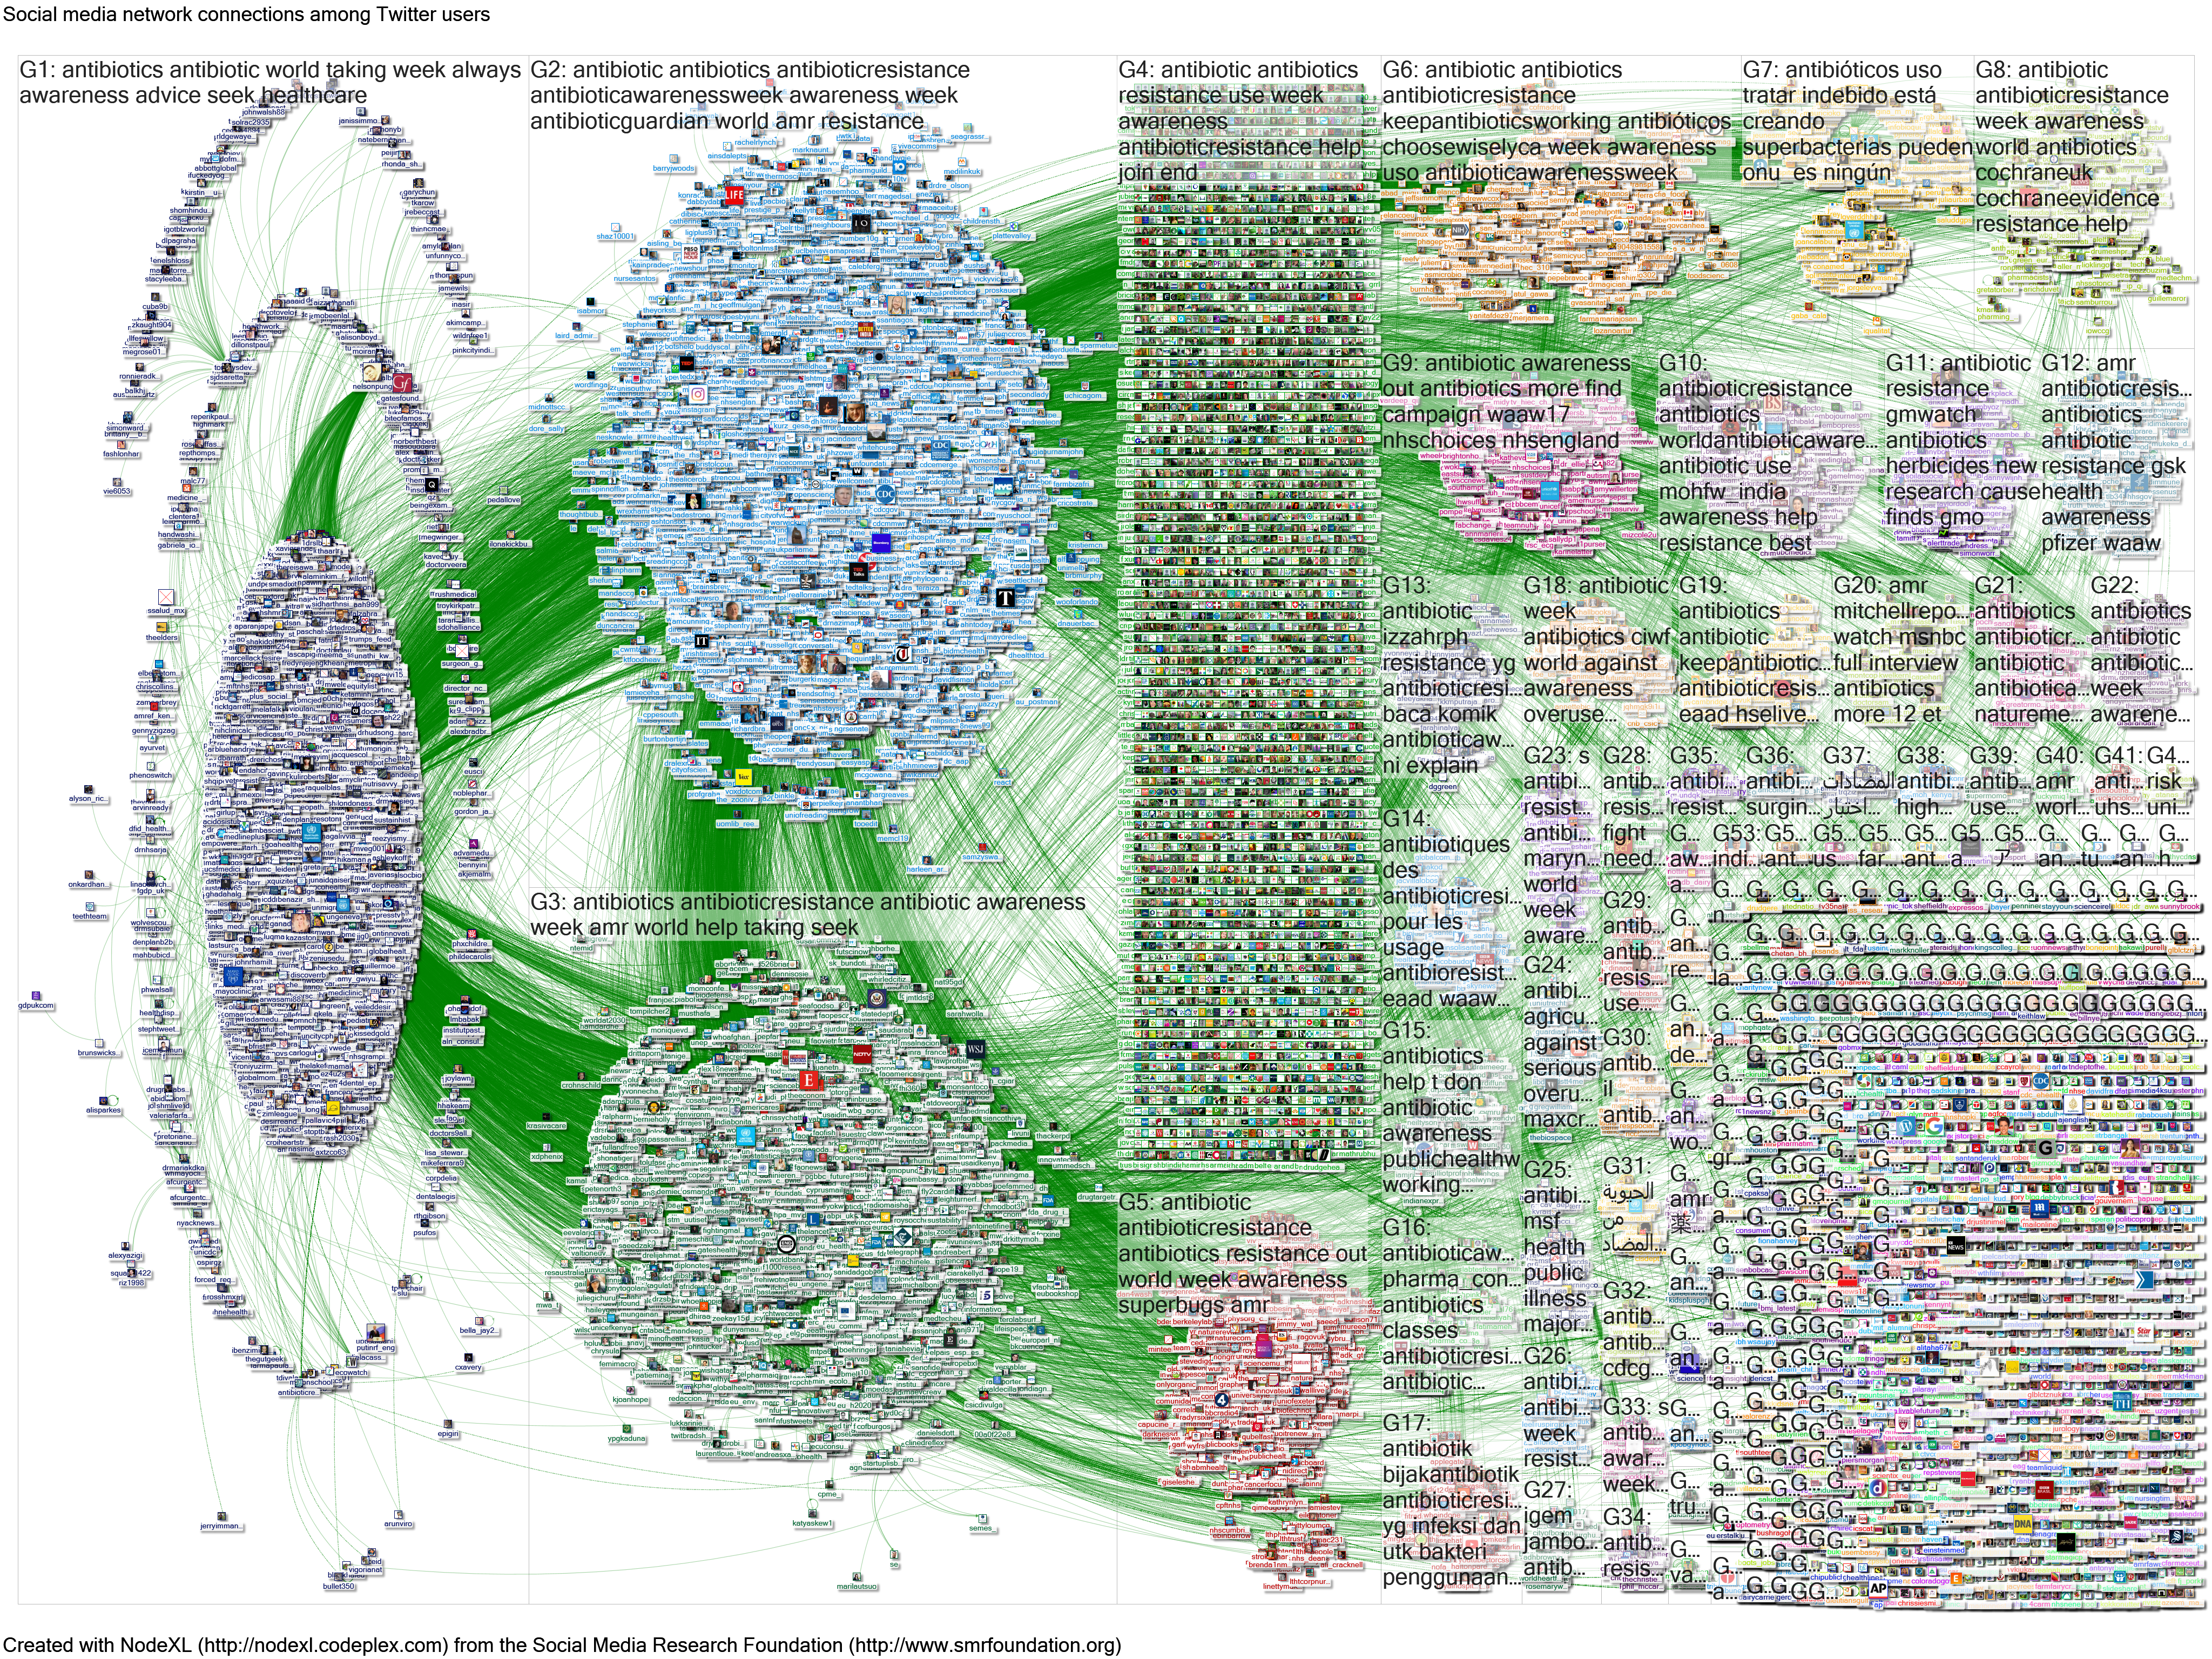
I used NodeXL to map the interactions around Twitter searches for some key terms (I searched for the period up to end of 10 November 2017 because the volume of more recent tweeting was overwhelming Twitter/NodeXL). I collated the top 20 tweets (by retweets) for the three main searches below into a Storify summary, repeating the Spanish language search to look just at the hashtag. This information has also been posted to this tweet thread and I will continue to update through the week.
| NodeXL map (click for hi-res map) | Search term (click link to go to full NodeXL report)
Median number of retweets (interquartile range) are for tweets included in the Storify summary. |
| Main hashtags
|
#antibioticresistance OR #antibiotics OR #eaad OR #waaw OR #doit4das OR #antibioticguardian OR “antibiotic awareness week” OR “antibiotic resistance” until:2017-11-11
Median 141 retweets (IQR 81-201) |
| Excluding main hashtags
|
“antibiotic awareness week” OR “antibiotic resistance” -#antibioticresistance -#antibiotics -#eaad -#waaw -#doit4das -#antibioticguardian -#waaw2017 -#amractionng until:2017-11-11 (minus sign in a Twitter and NodeXL search excludes that term from the search).
Median 72 retweets (IQR 53-125) |
| Antibióticos (word)
|
Antibioticos until:2017-11-11
Median 241 retweets (IQR 151-342) |
| #Antibióticos (hashtag)
|
#Antibioticos until:2017-11-11
Median 48 retweets (IQR 39-77) |
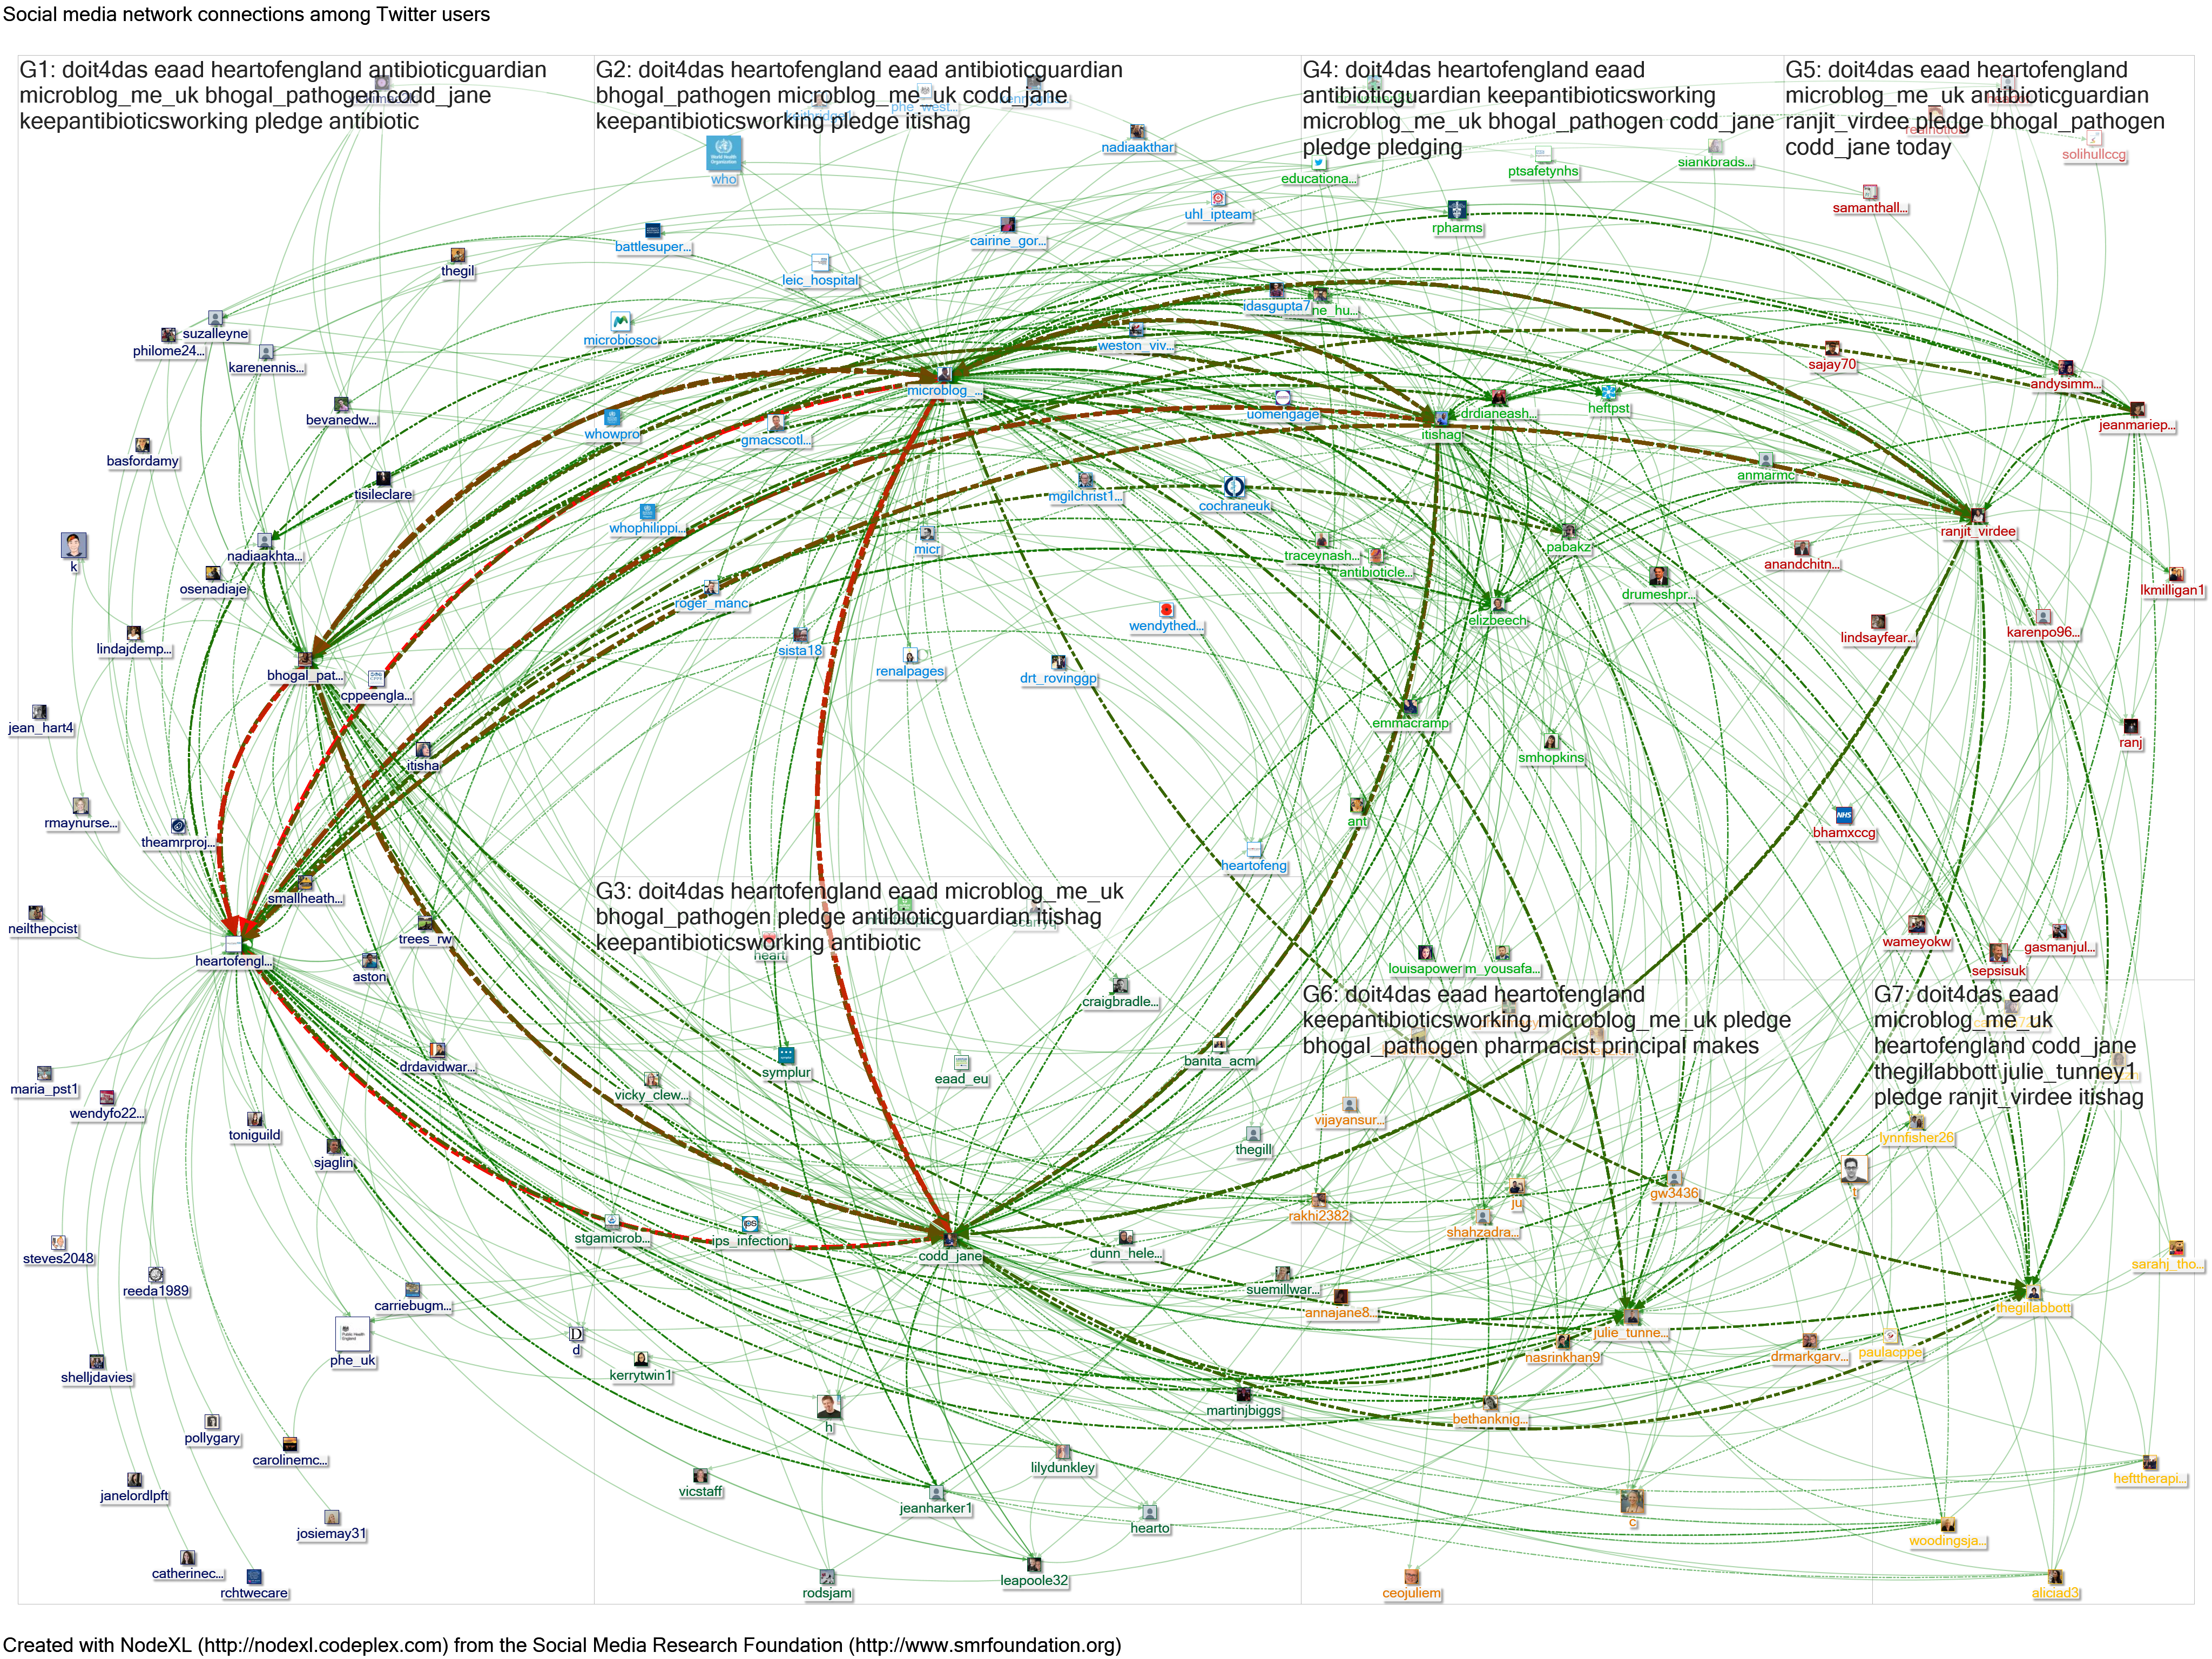
| #DoIt4Das: campaign in honour of the late Das Pillay
|
DoIt4Das |
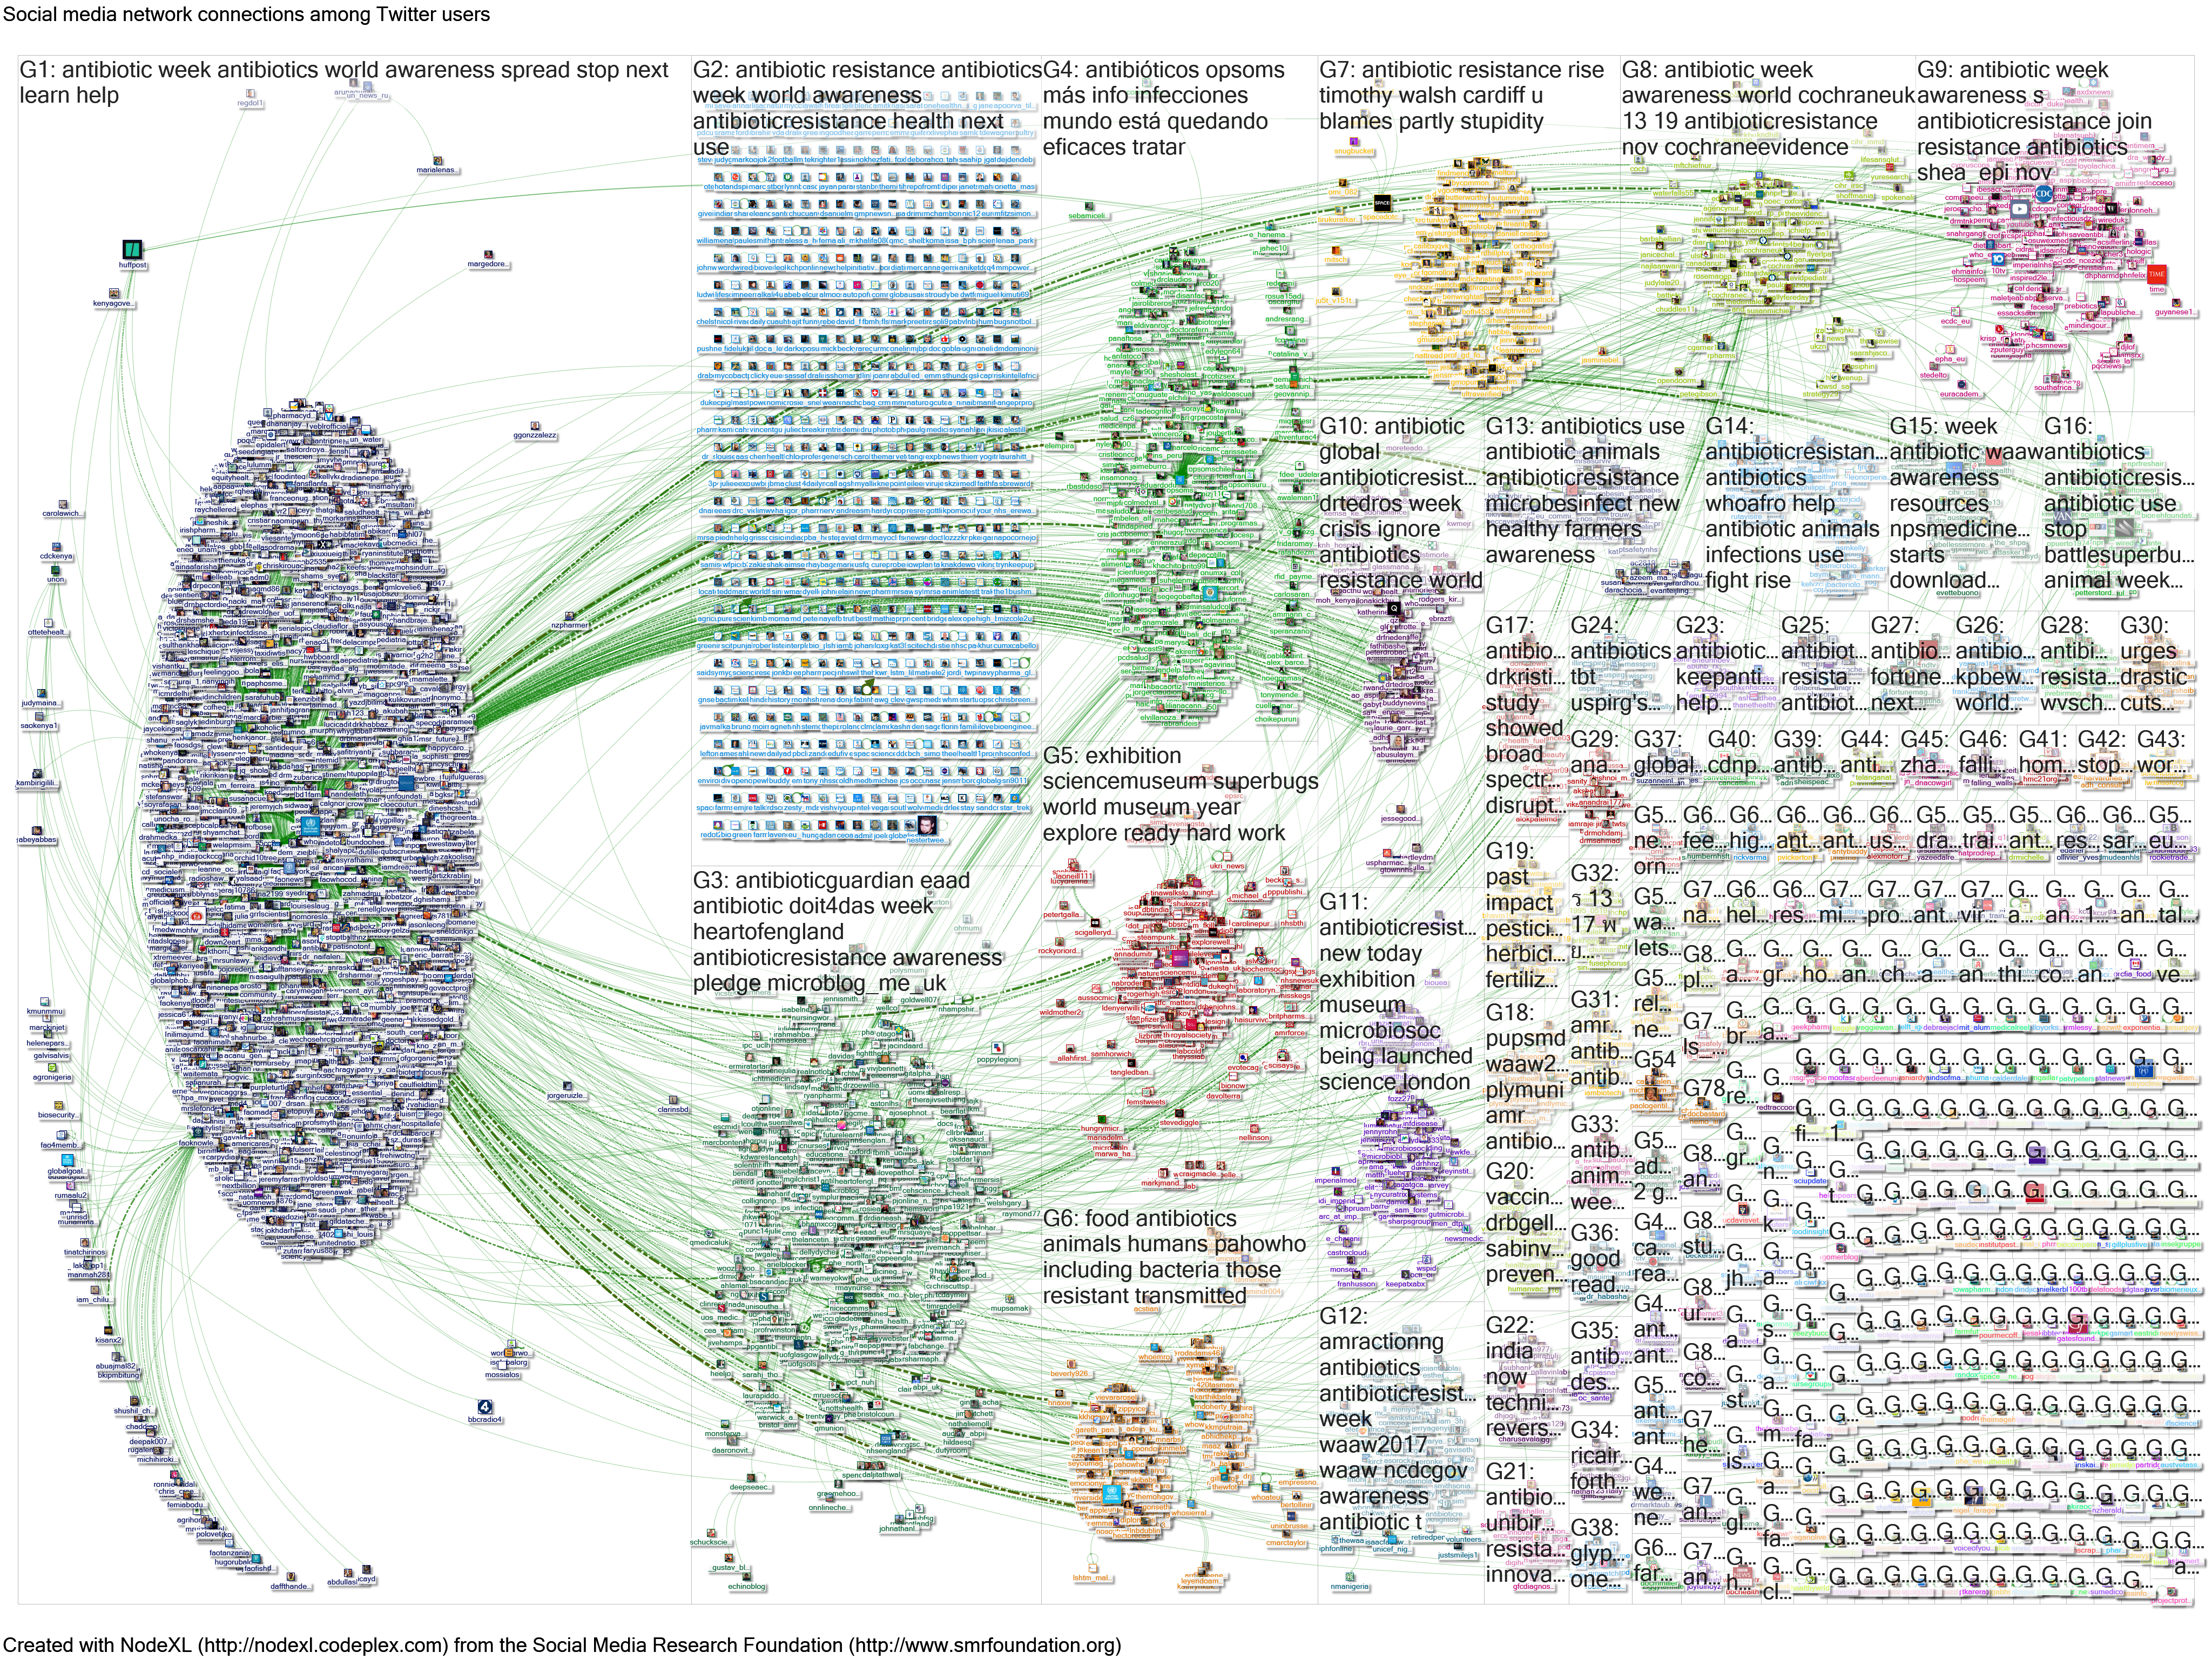
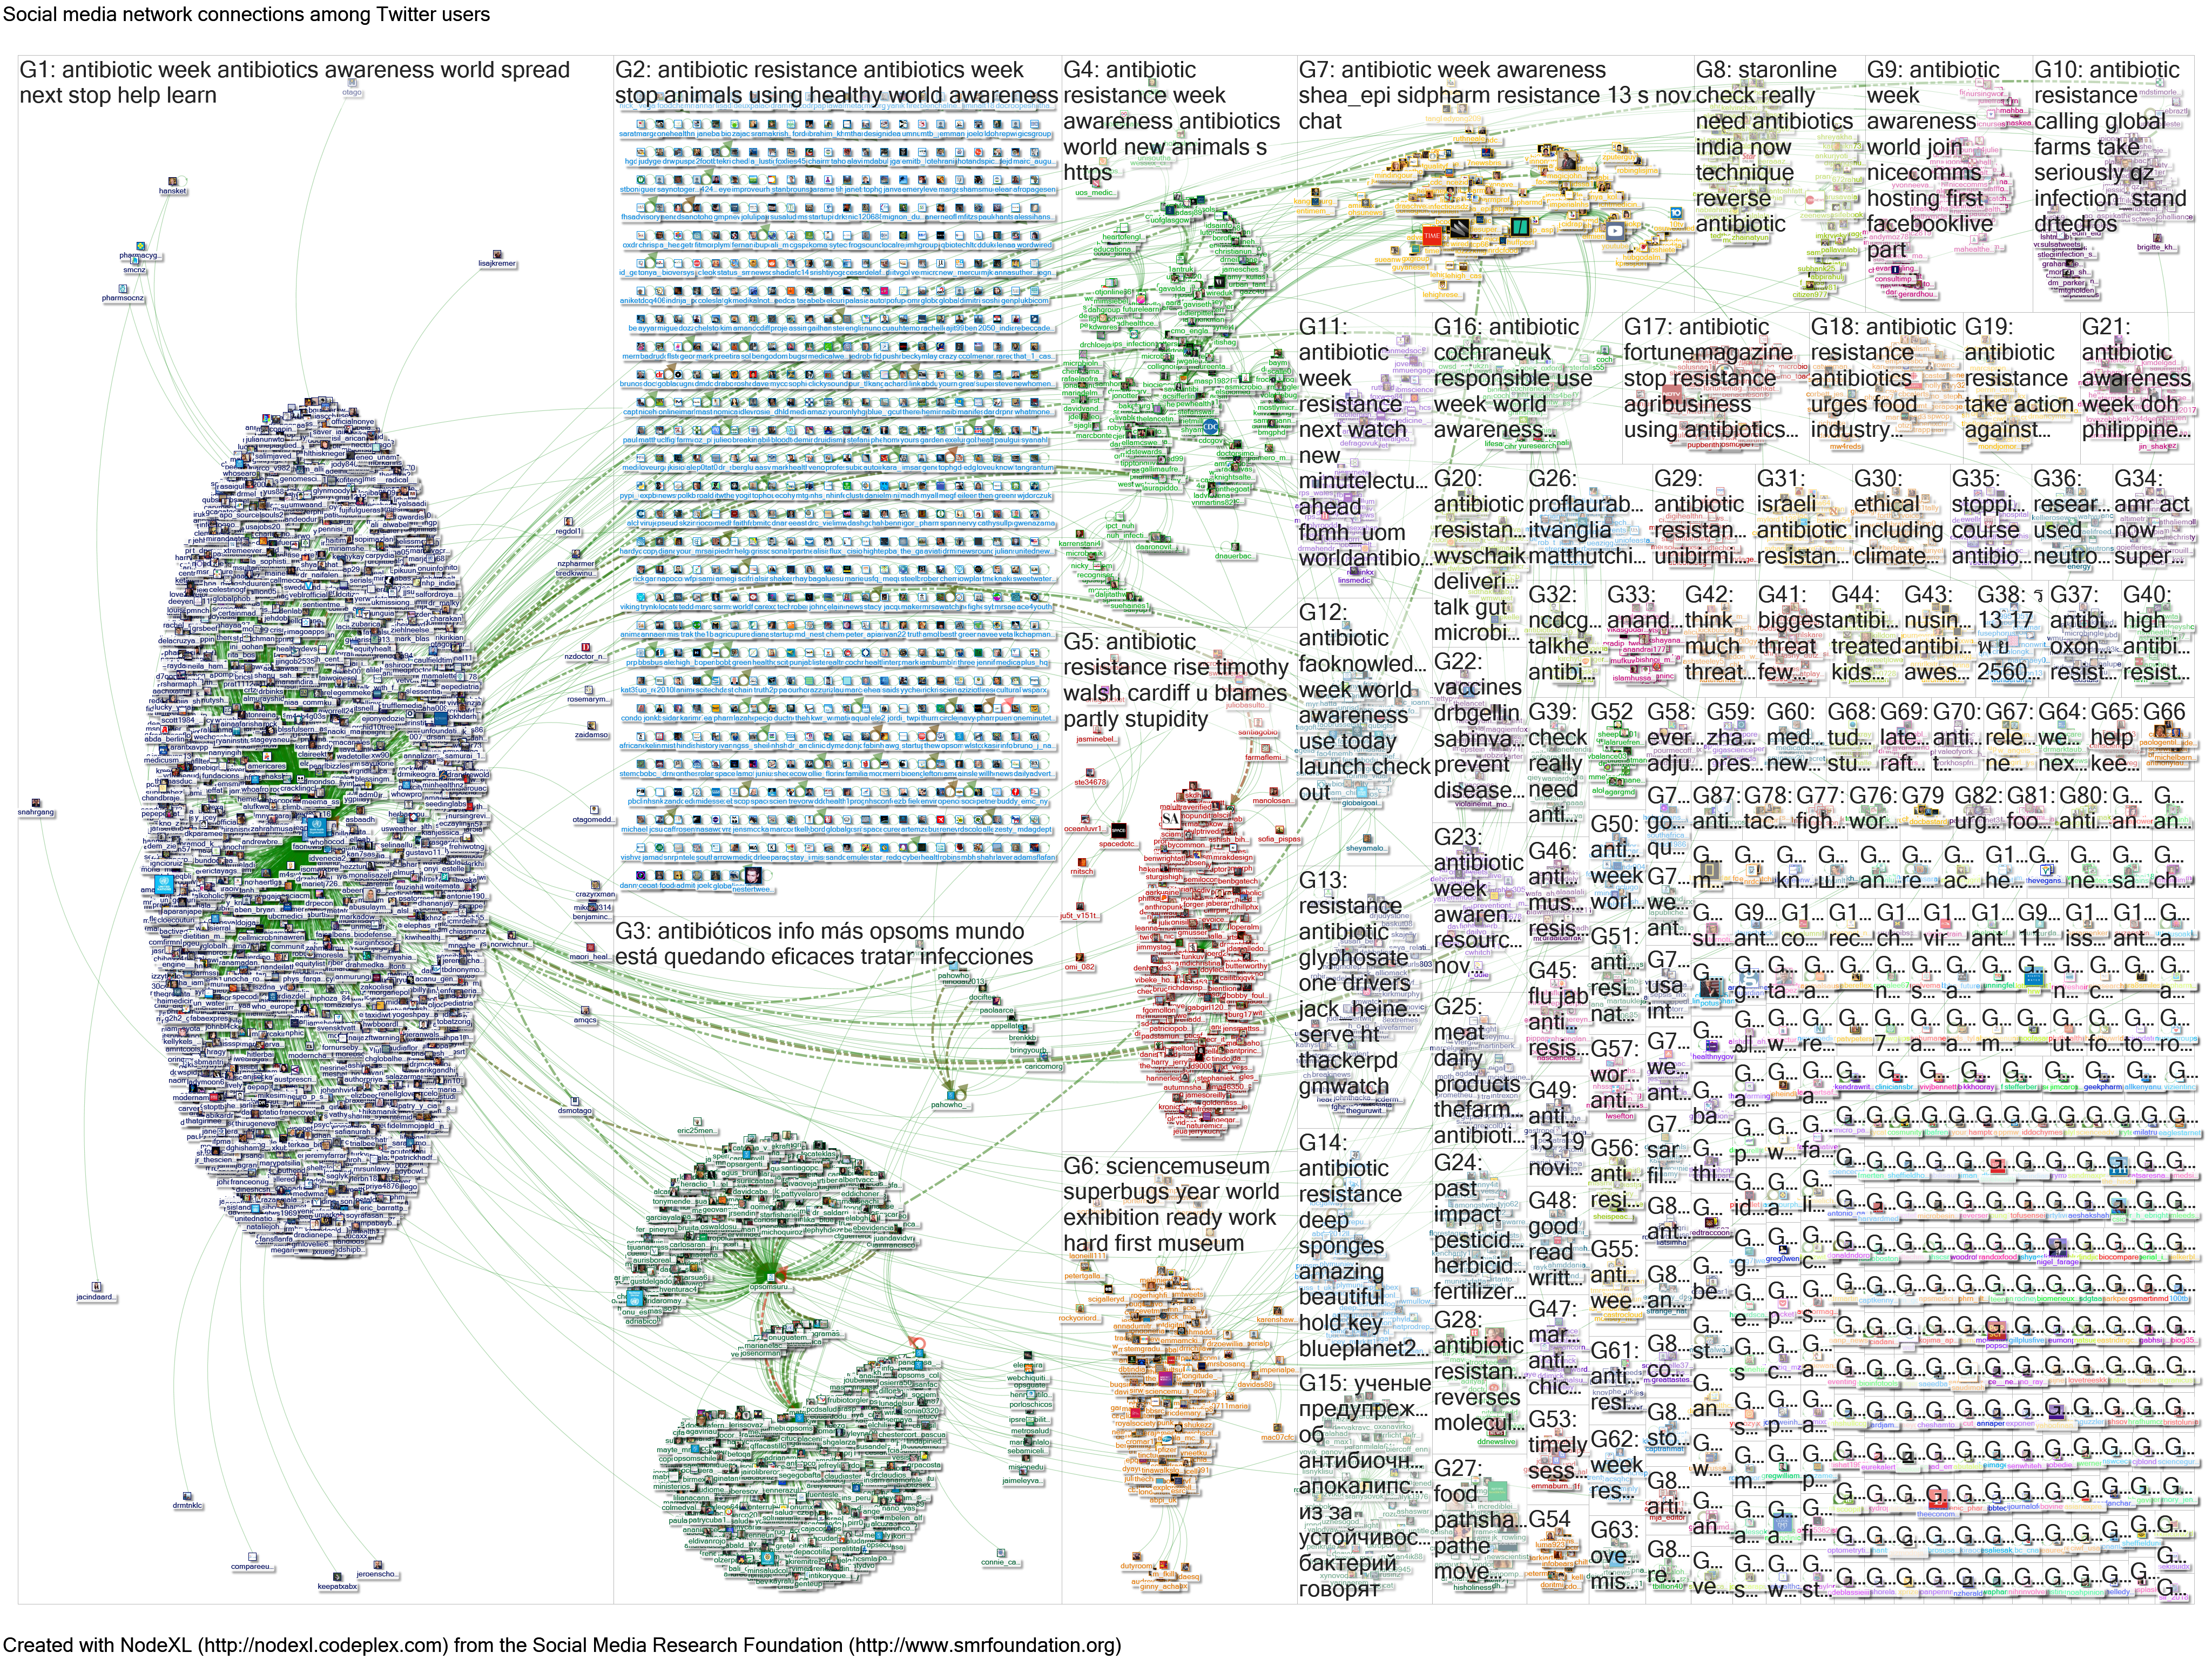
As can be seen from the Storify summary and average retweets in the table above, the tweet content, tweeters, and amount of onward sharing varies by choice of hashtag and the number of followers. A broad search strategy will be required to identify the range of tweeting over the course of the campaign week. The search excluding main hashtags identified additional hashtags including #superbugs (see summary stats for this hashtag leading up to the campaign). This and other campaigns will emerge during the course of the week, and will help you find useful content beneath the dominant “official” campaign. See previous blog with Chris Little and Chris Oliver for more on this.
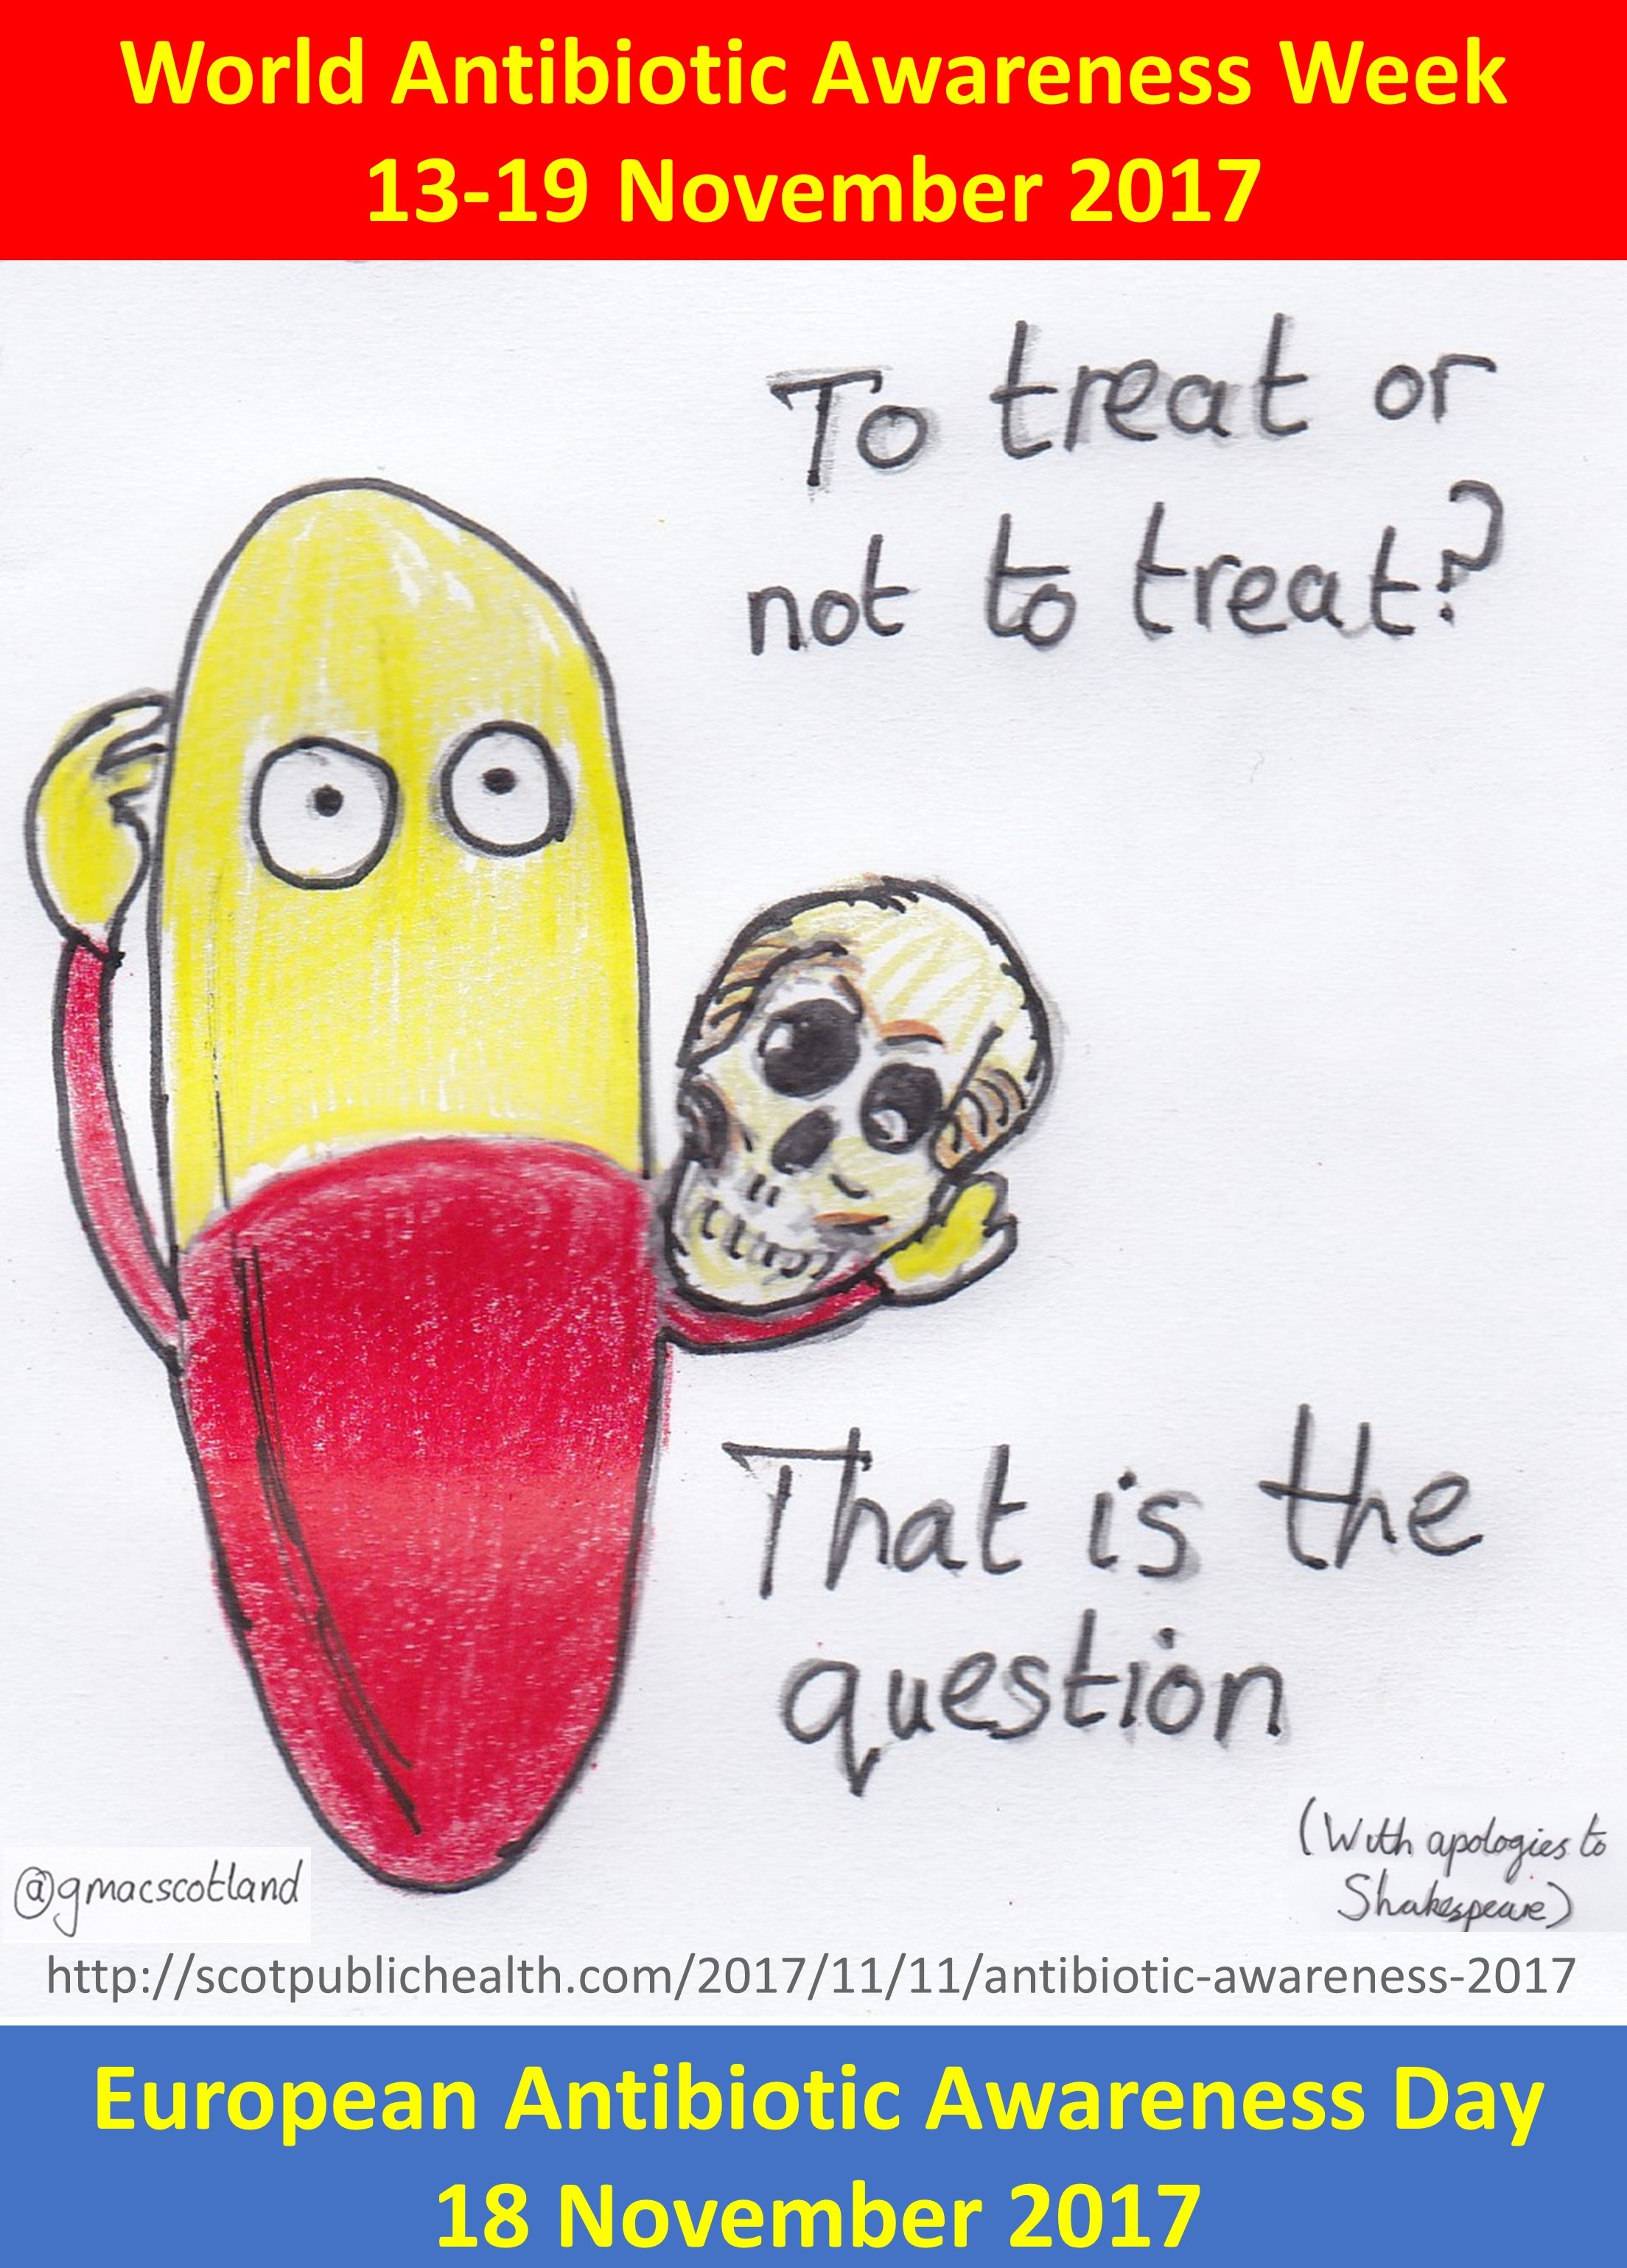
Check this blog and my tweets for further updates during and immediately after the antibiotic awareness week. Keep tweeting during the week, using hashtags (#AntibioticResistance plus #WAAW or #EAAD for world or European campaign), and mentioning colleagues and people whose work you are quoting. Also include a picture – feel free to use my “self-aware” graphic (referencing @gmacscotland).
You might also like this Hamlet themed image:
Updates:
- On 12 November I added #KeepAntibioticsWorking to the analysis (after tip off from Chris Finch). Maps and report in this tweet.
- NodeXL for 11 November here, now including #Superbugs and #KeepAntibioticsWorking.
- NodeXL for 12 November here.
- NodeXL for 13 November (11 hours) here. (Update 18 Nov – I have subsequently managed to extract full day – will look at this when time).
- Learning from 13 November, and the partial extract available, I ran three NodeXL extracts on 14 November: midnight to 09:07, 10:42 to 19:17, and then 10:42 to midnight. This therefore provided a much better coverage – all but 1 hour, 35 minutes from 09:07 to 10:42. I analysed the combined data in blocks, taking top tweets (by number of retweets) for four x six hour periods, pulling out 12 tweets from each period (ie 48 tweets in total). The results are collected in the ongoing Storify summary.
- I have been experimenting with combining NodeXL extracts to provide full maps for full days from partial extracts (I had to do this for World Diabetes Day on 14 November, which I will be writing up separately). This involves importing GraphML files from the NodeXL graph gallery page for each NodeXL extract, and making sure that you unselect the option to clear workbook on import. NodeXL report for day 3 (15 November) here, full resolution map here, combining 00:00 to 07:57, 09:29 to 18:18 and 16:20 to 23:59 (not all functions are preserved in the NodeXL report, but it shows interactions, top influencers and other content). Top tweets now added to Storify. I will ultimately combine all the extracts for the week into one large map.
- I have managed to extract a complete NodeXL map for day 4 (16 November): NodeXL report here with full resolution map here (still to pull out top tweets). I decided to stop tweeting because my tweets about the analysis around the week were artificially influencing the overall stats (eg betweenness centrality in NodeXL maps).
- So far day 5 (17 November) is proving elusive, with only very short extracts available – eg see this 28 minute extract(!)
- Day 6 (18 November) is also proving elusive. I have set up a TAGS extract as a backup, but hopefully tweets will be available via NodeXL after #EAAD (“top tweet” analysis much easier using NodeXL). You can download the TAGS file here.
- Day 7 (19 November) was also elusive. I therefore decided to wait until the end of the week before attempting another extract and “big tweet” summary. I started to combine the searches that I had obtained.
- On 20 November shortly after midnight I managed to extract the full weekend and 15 hours 39 minutes of Friday 17 November (from 08:27). An attempt to extract full data for 17 November was unsuccessful (14 hours 20 minutes). I therefore opted to use the most complete data that I had available to perform one large analysis for the week.
- Looking at 11 and 12 November there were 13 tweeters who accounted for tweets with 50% of the retweets (I will rerun this with the most complete extract available once the week has finished):
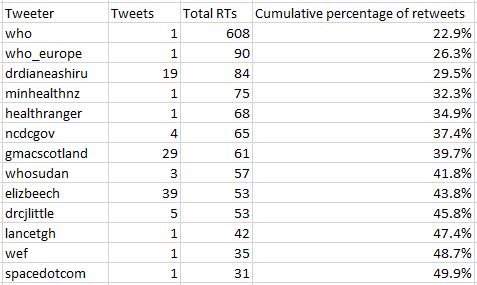
- The top tweets for each day will be updated in this Storify (NB inclusion in list does not necessarily mean that I support the views expressed in tweets)
- I have extracted information from Symplur health hashtags on selected hashtags. Note that the estimates of “impressions” should be viewed with caution – they appear to multiply number of tweets by number of followers. In my experience (comparing Symplur with Twitter analytics) the Symplur estimates are around 10 times higher than reality. The number of “tweets” quoted appears to equal tweets and retweets. The number of participants equals tweeters and retweeters. You can update Symplur health hashtags statistics at the links below, adjusting date range. You can look back for up to a year, for a three month window, so it’s worth saving outputs (availability will vary as some of the hashtags – eg #WAAW and associated, were only registered at the start of the week). While there are limitations to the estimates below, it is still useful to compare the figures – #AntibioticResistance is the most used hashtag by a considerable margin.
The table below summarises main figures, using Symplur healthcare hashtags (extended from noon on 12 November to noon on 20 November, UK time, to capture worldwide tweets), ordered by number of impressions (potential views on Twitter). Symplur provides access to these data for a year, so I have captured screen grabs for posterity: click image in right hand column for full details, including top influencers by mentions, tweets and impressions).
| Hashtag | Impressions | Tweets/ retweets | Tweeters/ retweeters | Full stats (click to zoom) |
| AntibioticResistance | 787M | 55,607 | 25,582 | 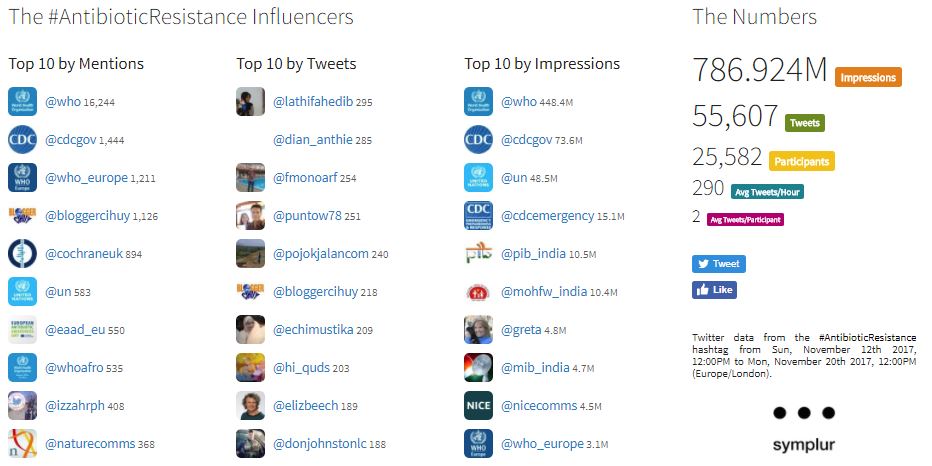 |
| StopSuperBugs | 274M | 9,252 | 6,027 | 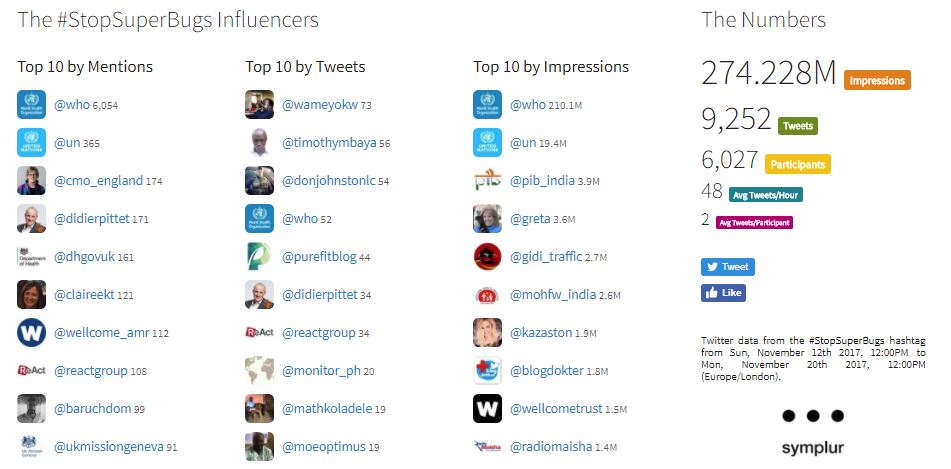 |
| AntibioticAwarenessWeek | 59.6M | 15,435 | 8,339 | 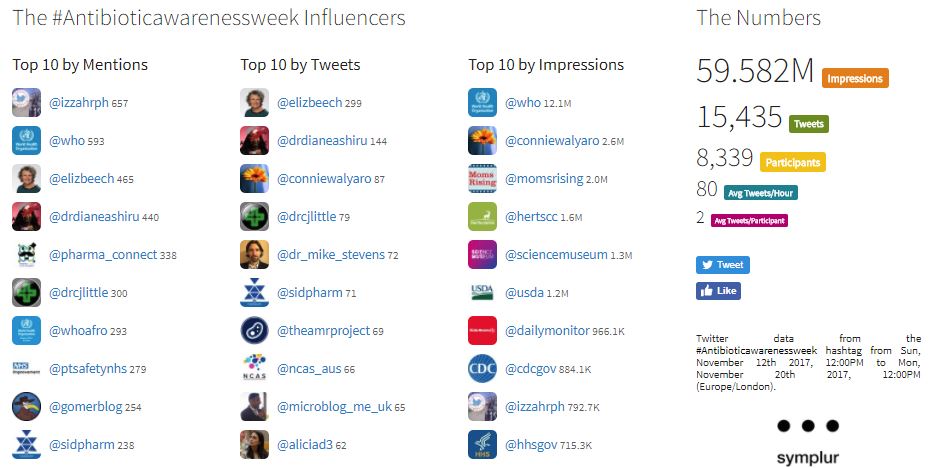 |
| KeepAntibioticsWorking | 56.6M | 15,740 | 6,842 | 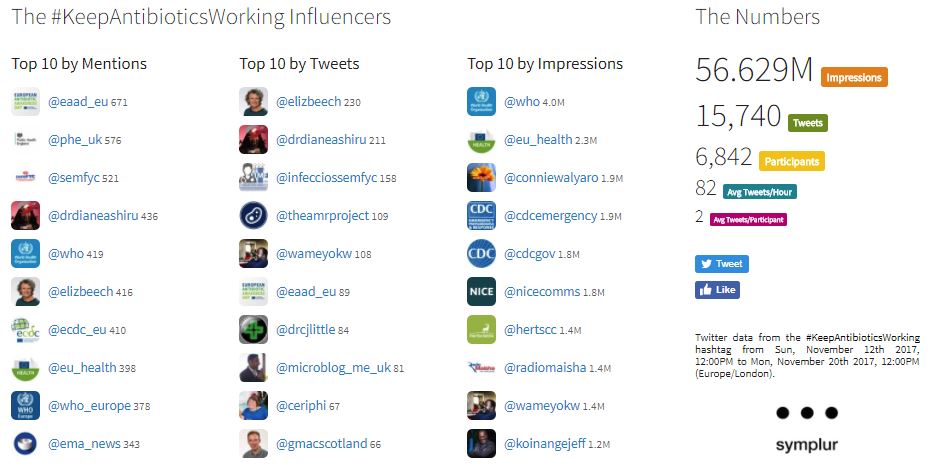 |
| WAAW2017 | 45.0M | 9,051 | 4,317 | 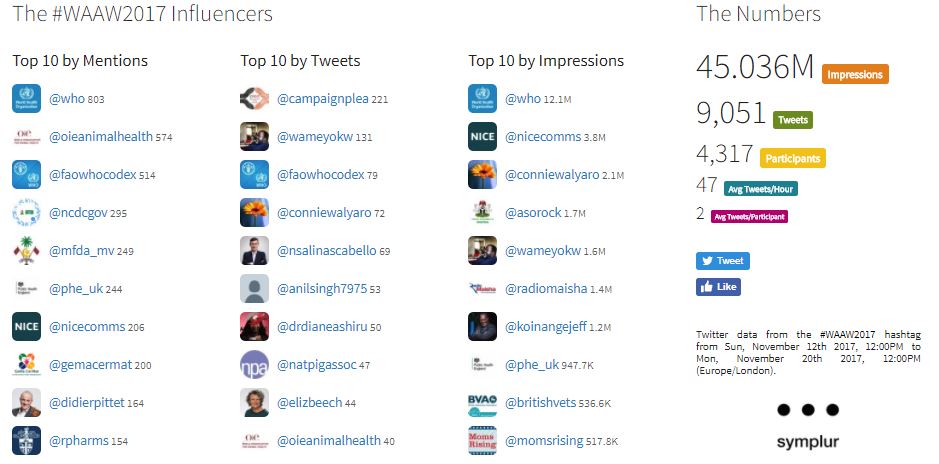 |
| WAAW | 43.6M | 8,585 | 4,204 | 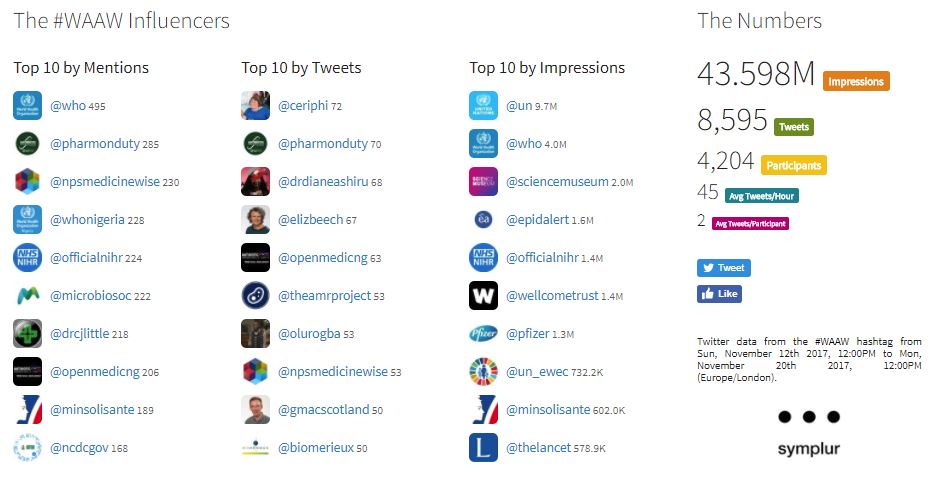 |
| EAAD | 30.3M | 8,514 | 3,277 | 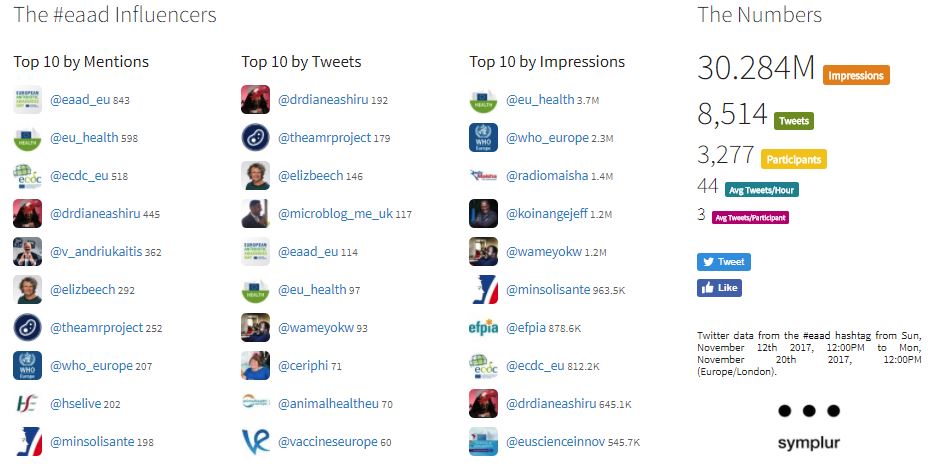 |
| Superbugs | 13.8M | 1,438 | 960 | 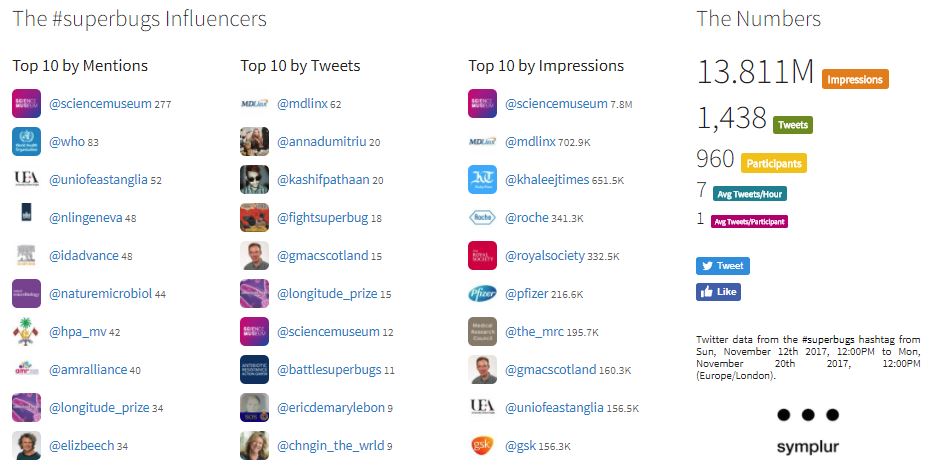 |
| AntibioticGuardian | 12.4M | 6,646 | 2,504 | 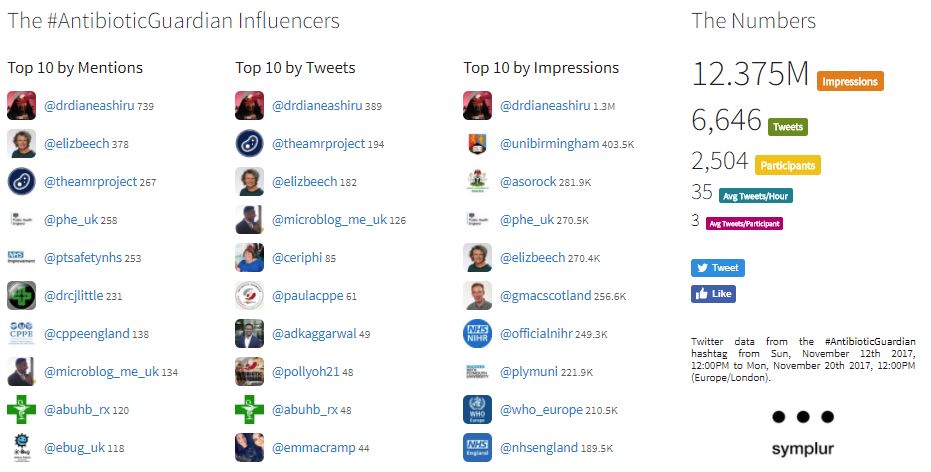 |
| WAAW17 | 6.6M | 1,574 | 1,034 | 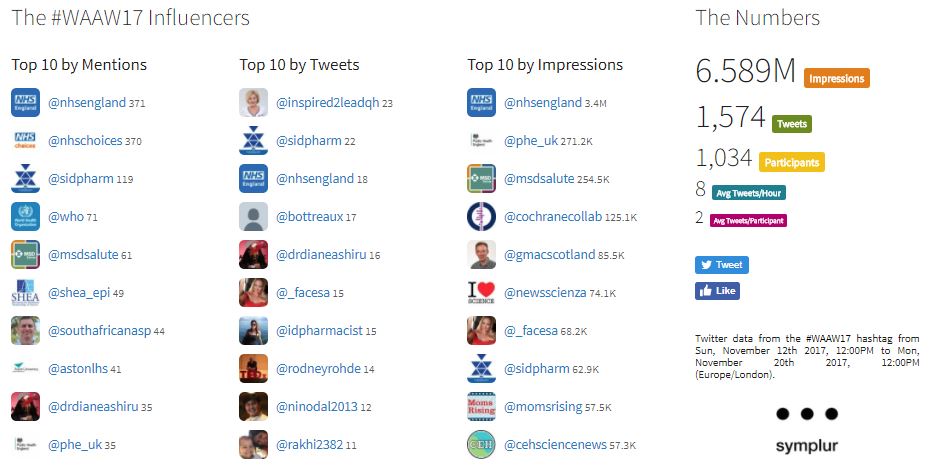 |
| EAAD2017 | 2.2M | 1,162 | 702 | 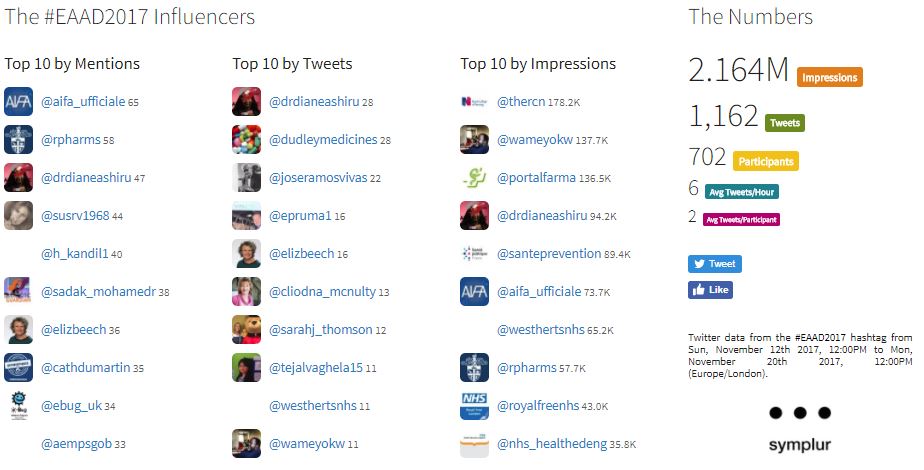 |
| EAAD17 | 953k | 114 | 75 | 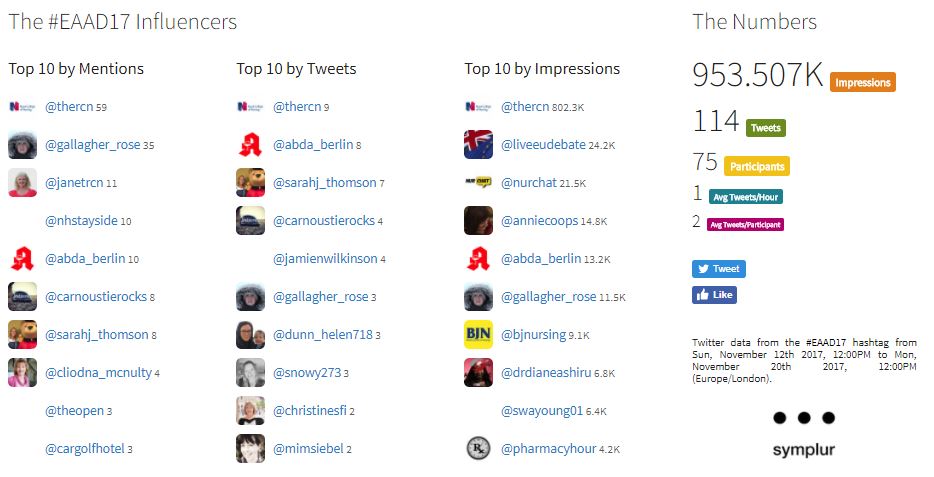 |
| DoIt4Das | 530K | 335 | 66 | 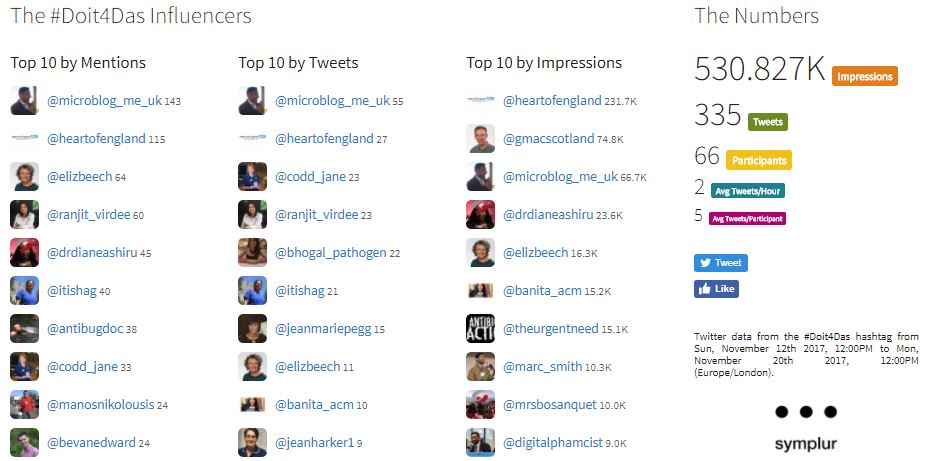 |
After days of processing the following map shows the fullest extract that I can produce (complete except 09:07-10:42 on 14 Nov and 07:57-09:29 on 15 Nov):
This is a map of 43,595 “edges” and 35,270 “vertices” (definitions here). I was not able to upload this map (perhaps due to processing power or bandwidth), but the data are available as an Excel spreadsheet (Dropbox link) and as a Powerpoint summary. I will analyse this information when time allows.
Dr Graham Mackenzie, Consultant in Public Health, NHS Lothian, 11 November 2017 and updated throughout the campaign.


Pingback: #EuroTestWeek and #HIVTestWeek – #ScotPublicHealth
Pingback: World Diabetes Day 2017 (14 November) – #ScotPublicHealth
prof premraj pushpakaran writes — let us celebrate European Antibiotic Awareness Day!!!
LikeLike
Pingback: Social network analysis: quirks, pitfalls and biases – #ScotPublicHealth