The BMJ cover story on 9 September 2017 explored a Twitter ban at a medical conference in the United States. The article included responses to the Twitter ban from two of the most prominent physician tweeters from the US (Prof Michael Gibson and Dr Kevin Campbell), a couple of comments from me, and social network analysis (SNA) that I had performed looking at the tweets that emerged from the conference. The analysis showed that the ban itself was a much bigger topic of conversation on Twitter than any clinical or scientific learning from the conference. In this blog I explore the reach and impact of the BMJ article on social media in the days after publication.
I have been using SNA for the past year, developing methods to explore the connections between tweeters and gleaning insights from the huge volume of tweets posted on medical topics. Example outputs from this work include an exploration of a World Health Organisation campaign week (#vaccineswork, April 2017) and summaries of international medical conferences (eg BMJ/ IHI International Forum on Quality and Safety in Healthcare, April 2017). These techniques in digital curation have helped me source materials for blogs and ideas for medical journal articles.
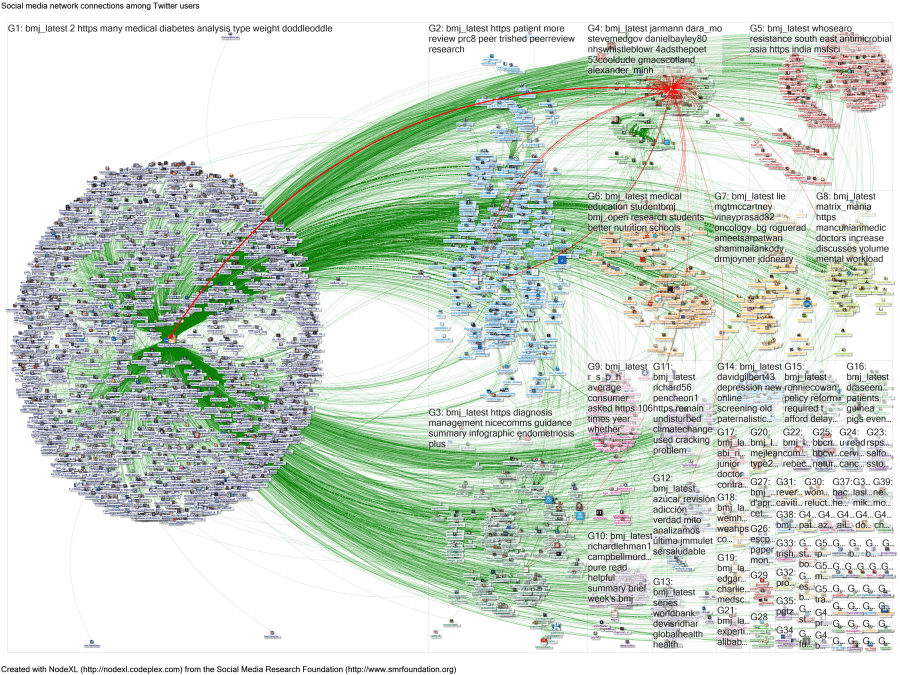
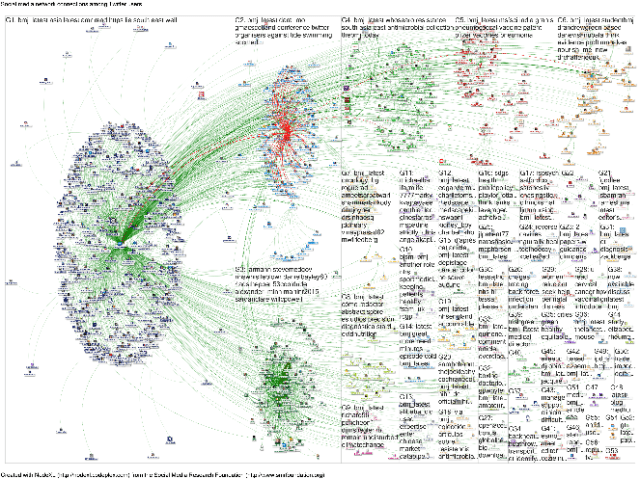
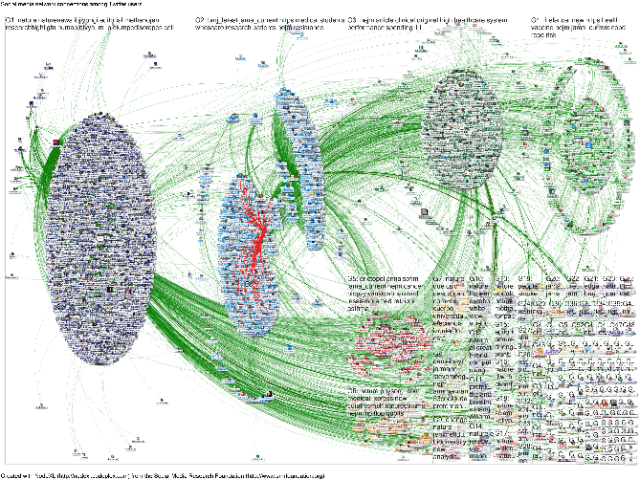
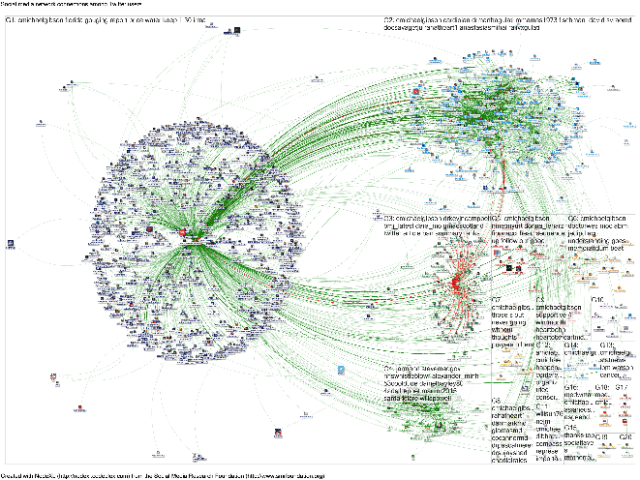
I used an Excel add-in called NodeXL to extract tweets for a series of searches for the period 6 to 9 September inclusive. I searched for @BMJ_latest by itself (2,577 tweets), a combined search of Twitter handles for the BMJ and five other global medical journals (17,075 tweets), and the big-name tweeters featured in the article. NodeXL maps display the interactions between tweeters. The NodeXL maps (Figure 1) show the dozens of interactions around journalist @dara_mo’s Twitter handle picked out in red. The Twitter ban story features prominently in each of these maps.
I then used the NodeXL extract to identify the most popular tweets. The 50 most retweeted stories in the global medical journal search included 6 tweets by or about the BMJ. The Twitter ban article featured in tweets at number 41 and number 45 of this global summary (full record of tweets included in this blog is provided via Storify).
Repeating the exercise for tweets by or about the BMJ over the same period identified 4 tweets about the Twitter ban article in the top 20 tweets (positions 5, 7, 10 and 19 by number of retweets). In total these 4 tweets had been retweeted 177 times in 4 days.
SNA can therefore be used to quantify the Twitter reach and metrics around a single article in a medical journal. Some of this information is also available from Altmetric data but without the ranking of posts or interaction between Twitter users. Altmetric data also provides information about other social media platforms. The Altmetric data for the Twitter ban article (Figure 2) shows that the article is in the “top 5% of all research outputs scored by Altmetric”, which is consistent with the findings of the SNA analysis.
The quantity of information on Twitter can become overwhelming when looking through different feeds and topics. The “top 50” approach to sorting tweets provides an accessible record of popular posts in an accessible summary. The act of retweeting a post reflects interest or controversy identified by another Twitter user, so these most popular tweets are likely to provide information that will educate, entertain or perhaps exasperate. The top 50 tweets from the global medical journal search identified 39 tweets by the journals and 11 by individuals and other organisations (Table). Some of the posts in the latter group reflected personal opinions in conflict with the journal article being cited. Controversy about a Nature editorial featured in 4 tweets from individuals in the top 50. Nature quickly issued an apology.
Looking at the bigger picture provided by this Twitter analysis, there is a linear relationship between a medical journal’s number of followers and connectedness (R2=0.9) (Figure 3). Size counts in social media, and the BMJ is clearly an important contributor to clinical and scientific stories at a global level.
The Twitter ban article and this subsequent analysis highlight the immediacy of social media, and the value of SNA in understanding the reach and spread of information on Twitter. The further use of SNA to identify the most popular tweets, and the most topical responses, is of benefit both to medical journals (in understanding their reach, reactions and impact) and readers (in contributing to continuing professional development). In addition to the three principle reasons for using Twitter as a doctor – learning, networking and sharing information – we can therefore add another function: analysing reach and punch. I will continue to post SNA summaries of conferences, medical journal tweets and health awareness campaigns on my blog and Storify page and welcome suggestions for future analysis.
Figure 1: NodeXL maps showing the reach of the conference Twitter ban article on Twitter between 6 and 9 September 2017. Interactions for the journalist Dara Mohammadi are highlighted in red.
| a. BMJ
|
b. Nature, NEJM, BMJ, JAMA, Lancet, Annals of Internal Medicine
|
| c. Dr Michael Gibson
|
d. Dr Kevin Campbell
|
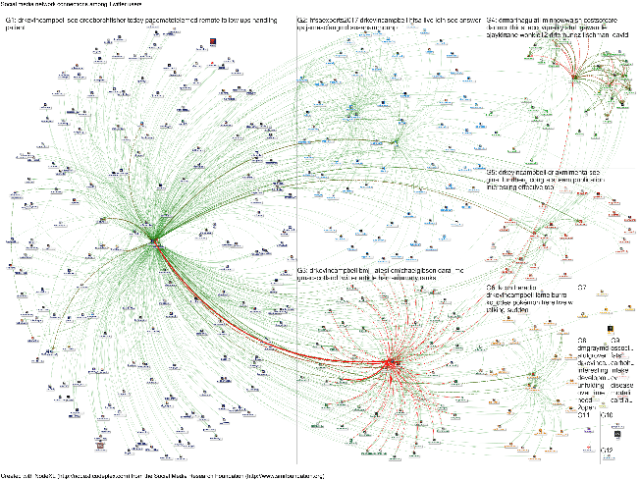
Source: NodeXL analyses collected on the Social Media Research Foundation NodeXL graph gallery.
Figure 2. Altmetric data for the conference Twitter ban article in the BMJ
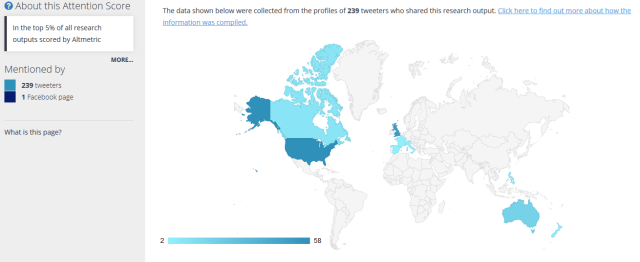
Source: https://bmj.altmetric.com/details/24862670 (accessed 13 September 2017 at 16:45 UK time)
Table: Number of tweets in the top 50 analysis of world’s top medical journals (see figure 1b).
| Journal Twitter account | Number of tweets by journal in top 50 | Number of tweets about journal in top 50 | Number of followers | Betweenness centrality (*) (million) on NodeXL map (figure 1b) |
| @Nature | 16 | 5 | 1.04M | 55 |
| @NEJM | 10 | 1 | 445K | 28 |
| @BMJ | 6 | 1 | 257K | 26 |
| @JAMA | 4 | 3 | 218K | 15 |
| @The Lancet | 3 | 1 | 279K | 12 |
| @AnnalsofIM | 0 | 0 | 25.4K | 2 |
(*) Betweenness centrality is a measure of the extent to which that user has control over information flowing between others
Source: NodeXL analysis collated in https://storify.com/gmacscotland/a-summary-of-tweets-about-twitter-ban-articleStorify summary
Figure 3: Number of followers on Twitter plotted against a measure of connectedness recorded in analysis shown in figure 1b.
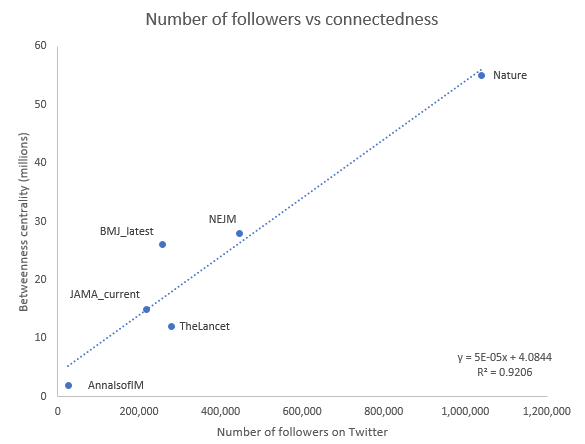
Source: See figure 2.
Dr Graham Mackenzie, Consultant in Public Health, NHS Lothian, 13 September 2017


Pingback: ScotPublicHealth: Quantifying the reach and punch of a single BMJ article on social media | ResearchBuzz: Firehose
Pingback: Parenting with Disabilities, WordPess, Vespa, More: Thursday Buzz, September 28, 2017 – ResearchBuzz
Pingback: Increasing the quality and impact of Public Health tweeting – looking beyond #ScotPublicHealth – #ScotPublicHealth
Pingback: What healthcare workers can learn from Twitter via green spaghetti junctions – #ScotPublicHealth