
My recent blog posts have looked at post hoc analyses of Twitter “big data” to describe conferences and awareness raising campaigns. This blog post looks at how “big data” can help identify high quality content to feature in a forthcoming campaign.
Air pollution, climate change and global warming are highly relevant to Public Health, with an up to date analysis provided in the Global Burden of Disease study in the Lancet. The #AirPollution hashtag is used in tweets throughout the year. I have extracted tweets that mention “air pollution” (from 12 and 13 June 2017) to identify potential content for “National Clean Air Day” on 15 June. The top 60 “air pollution” tweets (by number of retweets at 14:00 UK time on 13 June) are listed in a Wakelet summary. Searching for “air pollution” will identify tweets with the phrase itself or the hashtag. There is a wide range of content here, from Scientific American and Guardian news stories to other articles, infographics and tools, including posts and websites in French and one tweet in Japanese. The Guardian article was the most quoted “air pollution” story from this list. In order to demonstrate the range of people tweeting I have included each of the tweets in the top 60, but moving repeated stories to the end. The content (images, URLs etc) can be explored and used in new tweets specifically for the National Clean Air Day campaign.

This analysis used a NodeXL extract to identify the wording of tweets, find individual tweets using the Twitter search function, before recording and ranking the information in Excel. The whole process took a couple of hours, though can be done more quickly if simply looking for content rather than producing an accurately ranked list.
An alternative approach would be to use the URLs and influencers in the “top 10” lists in NodeXL reports to identify material, but that would not identify such a rich array of information. However if you’re in a hurry the automatically generated NodeXL reports are quick to produce. For example a NodeXL search for “air pollution” from last weekend identified articles from Telegraph, Business Insider, Salon and International Energy Agency websites, offering accessible information from a range of perspectives, with images, graphs and statistics that could be readily adapted to produce informative tweets.
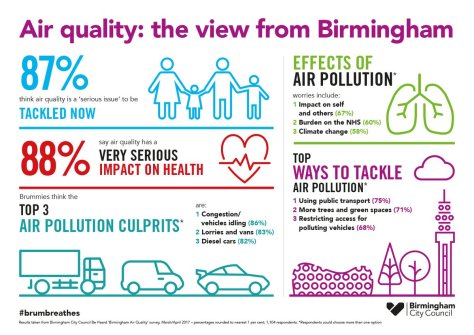
NodeXL also identifies top hashtags in the analysis, which can be useful in identifying hashtags to search for or include in tweets. However, the NodeXL extract for “air pollution” for 12-13 June did not identify any unexpected hashtags, or new hashtags emerging from the campaign (eg the abbreviations or snappy catchphrases that are sometimes identified – eg #whyivax, which was used by some tweeters during Immunization Week, when the official hashtag for the campaign was #VaccinesWork). Other hashtags, however, emerge from looking at the individual tweets in the top 60, following links, looking at top influencers’ Twitter profile and tweets, and searching out tweets using a combination of terms (eg combining a top influencer on the NodeXL map Clive Scubsole’s user name with the phrase “air pollution”). This approach (akin perhaps to a “grey literature search” for social media) identified the #brumbreathes campaign (for air quality in Birmingham, UK, also know as “Brum”).
Running a NodeXL analysis for #BrumBreathes identified new content (eg an informative short film), colleagues in Public Health in other cities, and some different materials. YouTube then linked that film to other National Clean Air Day films from other cities.
With suitable content identified to tweet, we can now move to explore the National Clean Air Day campaign itself. Having looked at other global campaigns recently the inclusion of the word “national” in this current campaign seems rather limiting: tackling air quality and climate change requires international solutions. And it raises the question whose “nation”? The clue is in the domain name for the campaign (.co.uk for United Kingdom) plus the Twitter username CleanAirDayUK. Some tweeters have chosen to drop the word “national” in their tweets, which saves characters, but which has implications for searching out tweets (searching for “clean air day” on Twitter will identify both phrases plus related hashtags, but as it searches username and content of tweets it may identify less relevant content).
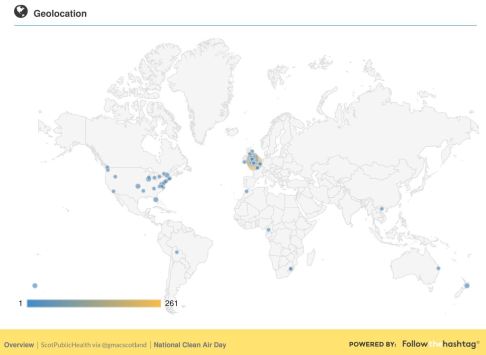
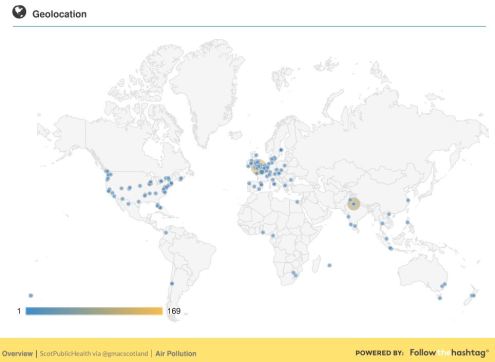
Other tools are available for hashtag searches. A sample of 1,500 tweets per hashtag mapped using FollowTheHashtag (below) shows that while #NationalCleanAirDay and #CleanAirDay tweets have come from across the world, there is clustering around the UK, with little tweeting outside UK and US (top map shows National Clean Air Day tweets). #AirPollution tweets had a more even spread across the world (bottom map), though the biggest single contribution was also from the UK, perhaps because of the “national” campaign. I have also submitted these hashtags to the Symplur healthcare hashtags site to track number of tweets, tweeters and impressions, but outputs are not yet available.
Tweeting for organised social media campaigns will begin before the actual start date. I ran a NodeXL analysis of #NationalCleanAirDay to look at activity before the campaign. This search (13 June 2017) identified 617 tweets from 479 Twitter users over the past 9 days and found top links to campaign materials and local activities in Fife, Birmingham and Southhampton (see NodeXL report in the NodeXL graph gallery).
If you’re interested in further insights on a range of topics going back over time you can use the NodeXL graph gallery site to search out NodeXL maps on a topic. The NodeXL graph gallery search function searches deep into the extracts, so it potentially identifies related topics – eg a NodeXL gallery search for “air pollution” identifies searches on electric cars, the American Thoracic Society conference 2017, global health and much more. Twitter only provides NodeXL with data for the past 9 days, so this depository is potentially a useful source of information, though for this particular topic I wasn’t able to find previous extracts for “air pollution” specifically in the gallery.
With content identified, and an understanding of the campaign, it is now possible to plan tweets (eg scheduling tweets in Tweetdeck). For this campaign I would recommend using the #AirPollution hashtag as well as the more local hashtags (eg #NationalCleanAirDay or #BrumBreathes if you’re in Birmingham). That combined approach will maximise chances of linking with colleagues across the world plus the local campaigns. While the #NationalCleanAirDay hashtag is relatively long, at least it describes the purpose clearly (aside from the potential confusion in using “national” in tweets that will reach an international audience). If tweeting on Thursday 15 June, National Clean Air Day itself, then it would be worth posting or retweeting a message that provides context (eg this post from @CleanAirDayUK).
I attempted to run a NodeXL extract following National Clean Air Day, but only short periods were available, even several days after the event. An alternative extract (searching for “clean aid day”) provided a subset of tweets to 21:05 (UTC) on 15 June.
“Big data” from social media therefore has its uses in planning, in addition to analysing and evaluating a campaign as described previously on this blog (eg analysis of VaccinesWork campaign).
Graham Mackenzie (@gmacscotland on Twitter)
Consultant in Public Health
13 June 2017

(Featured infographic is from #BrumBreathes campaign)

Pingback: Social network analysis: quirks, pitfalls and biases – #ScotPublicHealth