The Royal College of General Practitioners Annual Conference (RCGPAC) 2019 has embraced the use of social media to disseminate information to conference delegates and a wider audience beyond the conference hall. In an experiment at RCGPAC 2019, social media analysis was shared live from the conference hall throughout the conference, summarising the top content, identifying the main contributors and encouraging delegates to use the conference hashtag (#RCGPAC) to aid identification and dissemination of tweets. This idea emerged after an analysis of tweeting from the 2018 conference showed that a substantial proportion of tweets had omitted the official conference hashtag and were therefore less likely to reach their intended audience. Throughout the conference I shared social media analysis in a tweet thread and an ongoing Wakelet summary capturing the most popular tweets. This analysis has, in turn, fed into GP Online articles.

I developed methods for extracting and analysing tweets from medical conferences as a hobby, during evenings and over weekends, studying hundreds of medical conferences in this way over the past 3 years. The RCGP 2019 annual conference was the first conference that I have attempted to take a full range of methods into the conference venue itself. This has provided some excellent opportunities – hearing the presentations, meeting colleagues from across the UK, and discussing the results of social media analysis hot off the press with GPs and conference organisers. However, it has also presented challenges. Resources taken for granted at home are harder to come by in the conference venue, including WiFi, charging points and computer processing power. Tools that run efficiently on a powerful computer at home take hours to run on a basic laptop, so I initially relied on web-based applications that perform the brunt of the data extraction in the “cloud”. However, these tools sometimes provide only partial information (e.g. shortened tweets rather than providing the full text) or do not explain their operational definitions. Accordingly, definitive results take longer than expected to produce, trying up resources on the computer, and interim results need to be treated with caution. One example is the previously quoted results on use of the #RCGPAC hashtag. Preliminary analysis shared in the first GP Online article suggested that only half of the tweets posted on day 1 of the conference had used the hashtag. Subsequent analysis has shown that this was an underestimate as only truncated tweets were available using the online tool, thereby missing use of the hashtag in longer tweets[i]. Analysis at the end of the conference showed that hashtag usage at the 2019 conference was considerably higher than the 2018 conference, aiding dissemination of information during the conference and identification of the most popular content after the conference as a result. This definitive analysis, however, had to wait until my return home from the conference.
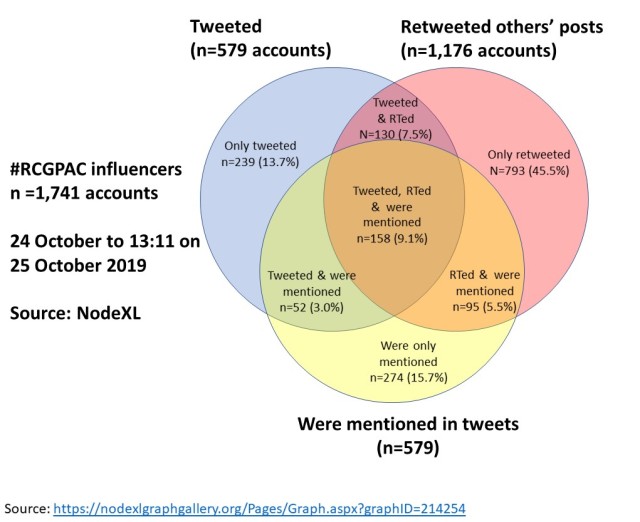
Figure. #RCGPAC: Venn diagram of tweeters, mentioned accounts and retweeters.

Identifying the social media influencers at a conference can help conference organisers understand ways to support dissemination of information. Analysis mid-way through the conference showed the contribution that organisations and individual tweeters made in posting original tweets and disseminating others’ content. A core group of tweeters (n=158) in the middle of the figure posted content, were mentioned in other tweeters’ posts and retweeted content posted by other tweeters. This group of influential tweeters identified mid-way through the conference already exceeded the total number of such tweeters identified in the 2018 analysis for the full conference period (n=146). Analysing this core group of tweeters for 2019 we can explore the different contributions made in 3 “top 20” tables – tweeters (Table 1), mentioned accounts (Table 2) and retweeters (Table 3). Organisations and individuals central to the conference feature prominently in all three tables: e.g. RCGP and related accounts, and RCGP Chair Professor Helen Stokes-Lampard. Individuals who made key contributions to the conference also feature in all three tables – e.g. Jamie Hynes (@ArtfulDoctor), who contributed the “If” poem based on Rudyard Kipling on day one of the conference; and John Griffiths who posted a particularly popular tweet on 15 minute consultations as featured in a GP Online article from the conference. Table 2 features several individuals who made important contributions to the conference from the main stage – e.g. Becky Malby in her session on networks on day one of the conference; and Jodie Blackadder in her contribution to the NHS Question Time session on day two. Table 3 includes individuals who were essential to the dissemination of messages from the conference, some of whom also posted popular tweets of their own. Many of these tweeters make year-round contributions to tweeting about General Practice outside the conference hall.

There is potentially other learning to draw from this Venn diagram. For example, understanding whether the “only retweeters” were delegates at the conference, but did not feel confident to tweet their own content. These were the single largest group in the analysis, and potentially need support to find their own voice on social media. Similar considerations apply to the other categories – e.g. helping the “only tweeters” find content that they would like to share from the thousands of tweets posted.
Use of social media can involve risks for conference organisers and delegates. For example, a paediatrics conference in the USA the week after RCGPAC used a hashtag that was shared with an Indian political party, making it difficult to quantify the clinical tweeting. That same conference was the target of protests, both outside the venue and on social media. Some filtering was therefore required to identify content that related specifically to the official conference (see my #AAP19 conference summary here). Human checking and curation is necessary to check the relevance and usefulness of social media information – for #AAP19 this involved a three stage process of identifying the top content, filtering out tweets from the most prolific protest tweeters, and performing a final visual check of tweets to identify a small number of tweets by less prominent tweeters.

In conclusion, social media has an important contribution to make to conferences such as RCGPAC, but the large number of tweets require curation and social media analysis requires careful interpretation. It is possible to run analysis live from a conference, producing useful summaries of the most popular content and novel insights. However, data extraction and analysis take a considerable amount of time and need to be tailored to the tools available. In the future conference organisers and delegates would ideally have this type of information available in real-time during the conference, but that would require further developments from Twitter or third-party software developers, and lessons from other conferences remind us of the importance of checking data and summaries before sharing.
Dr Graham Mackenzie, GPST1, Edinburgh, Scotland
See also
- Colin Cooper. How #RCGPAC delegates stormed Twitter on the first day of conference. 24 October 2019. GP Online.
- G Mackenzie. How not to waste time when tweeting at #RCGPAC. 25 October 2019. GP Online.
- Colin Cooper. How #RCGPAC delegates smashed Twitter targets at the 2019 conference. 27 October 2019. GP Online.
[i] It turns out that I was using an old version of TAGS – the most recent version extracts the full tweet and is available at https://tags.hawksey.info/get-tags/

Table 1: Top 20 tweeters from central category in Venn diagram, ranked by number of retweets received.
| Tweeter | Retweets received | Tweets posted |
| 1. rcgp | 220 | 75 |
| 2. drjongriffiths | 58 | 5 |
| 3. rcgpac | 56 | 22 |
| 4. drjohncosgrove | 51 | 55 |
| 5. sg_primarycare | 48 | 12 |
| 6. gponlinenews | 44 | 9 |
| 7. docshawkat | 42 | 18 |
| 8. rcgpfaculties | 42 | 61 |
| 9. drgandalf52 | 41 | 48 |
| 10. gregjirving | 39 | 5 |
| 11. artfuldoctor | 38 | 34 |
| 12. meassociation | 37 | 3 |
| 13. rcgpwales | 34 | 28 |
| 14. abi_rimmer | 33 | 15 |
| 15. helenrcgp | 33 | 8 |
| 16. nhsdiabetesprog | 33 | 18 |
| 17. capcbristol | 29 | 8 |
| 18. jodieblackadder | 27 | 4 |
| 19. gmacscotland | 27 | 23 |
| 20. mymenopausedr | 27 | 6 |
Source: NodeXL, tweets posted during 24 October or up until 13:11 UTC on 25 October 2019. https://nodexlgraphgallery.org/Pages/Graph.aspx?graphID=214254
Table 2: Top 20 tweeters from central category in Venn diagram, ranked by number of mentions in original tweets (excluding replies).
| Mentioned account | Mentions (tweets, not replies) |
| 1. rcgpac | 308 |
| 2. helenrcgp | 214 |
| 3. rcgp | 209 |
| 4. beckymalby | 60 |
| 5. gmcuk | 59 |
| 6. jodieblackadder | 41 |
| 7. rcgpfaculties | 27 |
| 8. doctormayur | 19 |
| 9. careylunan | 19 |
| 10. mymenopausedr | 18 |
| 11. drjongriffiths | 17 |
| 12. nextggp | 17 |
| 13. drgandalf52 | 16 |
| 14. rcgp_ni | 14 |
| 15. nhs_srmc | 13 |
| 16. artfuldoctor | 12 |
| 17. rcgpwales | 11 |
| 18. drlucyloveday | 11 |
| 19. nhsenglandevent | 10 |
| 20. capcbristol | 9 |
Source: NodeXL, tweets posted during 24 October or up until 13:11 UTC on 25 October 2019. https://nodexlgraphgallery.org/Pages/Graph.aspx?graphID=214254
Table 3: Top 20 retweeters from central category in Venn diagram, ranked by number of retweets made.
| Retweeter | Retweets made |
| 1. rcgpac | 133 |
| 2. rcgpfaculties | 74 |
| 3. rachaelmarchant | 39 |
| 4. sonia_helen | 38 |
| 5. drjohncosgrove | 35 |
| 6. helenrcgp | 32 |
| 7. nhsenglandevent | 28 |
| 8. cavgp | 25 |
| 9. drjongriffiths | 21 |
| 10. artfuldoctor | 21 |
| 11. rcgphumber | 21 |
| 12. rcgpwales | 20 |
| 13. rcgp | 19 |
| 14. gmcuk | 18 |
| 15. cizcg | 18 |
| 16. capcbristol | 17 |
| 17. drcotovelo | 17 |
| 18. ebmulla | 17 |
| 19. dirkpilat | 16 |
| 20. docscott82 | 16 |
Source: NodeXL, retweets made during 24 October or up until 13:11 UTC on 25 October 2019. https://nodexlgraphgallery.org/Pages/Graph.aspx?graphID=214254
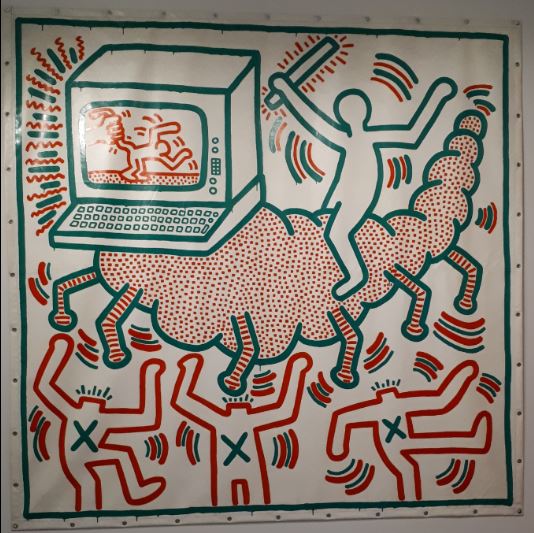
Cover image is from Keith Haring exhibition at Tate Liverpool. This is how it felt trying to listen, tweet, and analyse tweets at the same time!

