
Conferences are an important way of sharing new medical and scientific knowledge. Twitter is an important way of summarising and sharing information from conference. This blog sets out to answer the question: “Have we reached peak tweeting at medical conferences?”. Popular social media tools produce quite misleading results, combining tweets and retweets, tweeters and retweeters, reporting potentially huge audiences based on questionable assumptions. Instead, this analysis uses raw data, breaking down results for tweeters and retweeters. It reports on 3 years of tweeting (2016-18) about four conferences (two public health, one anaesthetics, one quality improvement conference). The answer to the question whether we have passed peak tweeting is: “It’s too early to say whether we have passed the peak, but we quite possibly have, and conference tweeting is certainly evolving”.
Now of course 3 data points do not demonstrate a trend: you need 10-12 points or more for a run chart. Nonetheless, it is of interest that compared with 2017 there were fewer people generating original content at each of these medical conferences in 2018. These four conferences had quite different contributors and audiences, but the findings are consistent. Perhaps the pattern is real, and reflective of wider changes in conference tweeting. The number of tweets also dropped overall, but that may be explained by an increase in number of characters allowed in a tweet (from 140 to 280, November 2017). There was also less retweeting between 2017 and 2018 for three of the conferences.
Nonetheless, there is great content out there, and conference tweeting is maturing, and is likely to continue to evolve. We see the emergence of rapporteurs, specifically setting out to record the conference proceedings in imaginative ways. The Intensive Care Society State of the Art conference is leading the way in this area, and Helen Bevan and colleagues at NHS Horizons continue to generate fabulous content in their general and conference tweeting.
I also highlight that there are some limitations to current social network analysis:
- Reports of conference audience/ reach on social media (Symplur, Twitonomy, Followthehashtag) are typically wildly optimistic and should be ignored. Their reports on influencers are potentially useful, but should be interpreted with caution.
- Replies that do not use the conference hashtag are not captured, and sometimes include rich information. This requires more sophisticated tools and analytical approaches adopted from qualitative research methods.
- Retweets are under-represented in NodeXL reports, and this can sometimes result in very odd results.
That’s me signing out of social media analysis for the time being. I’m off to retrain as a GP, returning to a clinical training grade for the first time in almost 20 years.
Introduction: This week I move to a new post. For the past 11 years I have been a Consultant in Public Health Medicine. On Wednesday 6 February 2019 I hand in my purple consultant badge, replacing it with the green badge of a first year trainee GP, moving from office and committee room to clinic and hospital ward. This will complete the medical training that I started almost 25 years ago (I graduated from medical school in 1995 and worked for 6 years in hospital medicine, including two years in a clinical research post, before moving to public health in 2001).
This GP training will involve learning a lot of new skills, and new perspectives. It will involve a lot of reading, studying and exams. I am therefore wrapping up pieces of work that I developed as a public health doctor before I move on.
As a hobby, between October 2016 and December 2018 I studied tweeting at medical conferences, extracting tweets from around 200 conferences on a range of medical topics. I analysed the extracts to produce summaries of these conferences, collected on the Wakelet site. The methods are written up elsewhere on the ScotPublicHealth site. I have written up some of this work in peer reviewed journals, both as sole author and with co-authors, and as a blog for an international sports medicine journal. Further manuscripts are being prepared for submission to journals, conferences, and in contributions to official reports for a Government agency and a national grass roots campaign. These publications and presentations describe the development of methods in extracting, exploring, understanding, summarising and curating social media data on medical topics.
This blog adds to this work. It looks at the 4 conferences for which I have 3 years of data (2016, 2017 and 2018 conferences), covering public health (APHA in USA, EPH in Europe), anaesthetics (UK’s Intensive Care Society State of the Art – ICSSOA) and quality improvement (Institute of Healthcare Improvement’s IHIForum). [I attended one of these conferences – EPHStockholm, November 2017. I also have data for the Scottish Faculty of Public Health Conferences 2016-18, but I decided not to include these conferences as I was involved in organising social media activity for 2016 and 2017.]
Various social media tools provide reports on hashtag use, and are commonly used in conference summaries (e.g. Symplur, Followthehashtag, Twitonomy). The reports give totals of tweets, contributors and influence. They do not, however, provide operational definitions and it is easy to misunderstand their outputs. For these tools, “tweets” = tweets + retweets; contributors = tweeters and retweeters; impressions and audience are massively over-estimated. This is important as poorly estimated outputs can give the impression of ever-increasing tweeting and audiences. “Mentions” include the tweets posted by that user, rather than focusing on tweets by other users mentioning that user. An example of a Symplur report is provided in this tweet.
In contrast to these other tools, this report uses raw data from NodeXL (and in one case TAGS). Unless otherwise stated “tweets” = original tweets and replies (i.e. not retweets). Tweeters = accounts posting original tweet and replies and not retweeters. “Mentions” are specifically references to other users (excluding replies because they are displayed differently to ordinary tweeters).
Methods: Sometimes it was not possible to extract full data across all conferences, despite repeated attempts. The conferences ran in the same time zones and with the same structure each year (length of conference, pre-conference days etc). Accordingly, the analysis has been restricted to the periods where data were available for the same periods across all three years (by minute). The extracts were obtained using NodeXL, except ICSSOA2018, which was obtained using TAGS and then imported into NodeXL.
The periods used for comparison are shown in the table (click on the URLs in the table to view summary of “top tweets” using NodeXL data and Wakelet):
| APHA | EPH | ICSSOA | IHIForum | |
| 2016 | 29 Oct to 2 Nov | 9-12 Nov | 5-7 Dec | 4-7 Dec |
| 2017 | 4-8 Nov | 1-4 Nov | 4-6 Dec | 10-13 Dec |
| 2018 | 10-14 Nov | 28 Nov – 1 Dec | 10-12 Dec | 9-12 Dec |
| Periods for comparison of tweeting by year | 2016 extract incomplete:
Day 1 starts 19:43 UTC Days 2 and 3 were complete Day 4 includes tweets posted 14:43-22:29 UTC Day 5 ends 19:40 UTC |
Full period available | Full period available | 2016 extract ends at 18:26 UTC on final day |
Results: Studying the same periods across the years for the different conferences we can see the following patterns:
The number of tweets decreased between 2016 and 2018 at three of the four conferences. This finding is complicated by the fact that the number of characters in a tweet increased from 140 to 280 on 7 November 2017, after EPHStockholm, overlapping with the end of APHA2017, but before ICSSOA2017 and IHIForum. The latter three conferences had a decrease in number of tweets posted between 2017 and 2018. The change in character limit has certainly impacted on conference tweeting, with users posting substantially longer tweets in 2018 than 2016 (data from ICSSOA).

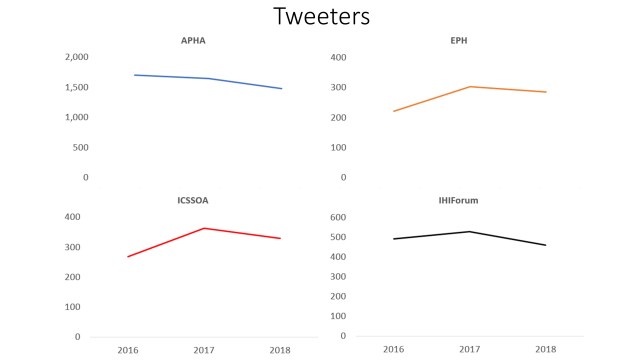
The number of tweeters for all the conferences decreased between 2017 and 2018. That means that there were fewer people or organisations generating original content about the conferences in 2018.
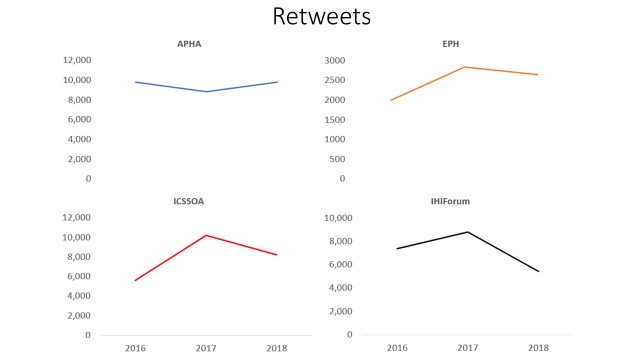
The number of retweets also decreased between 2017 and 2018 for three of the four conferences.
The combined number of tweeters plus retweeters increased between 2016 and 2018 for two of the conferences, but declined between 2017 and 2018 for the other two conferences.

The percentage of tweeters receiving no retweets during the conference period varied by conference (40-45% for APHA; 20-30% for EPH; 20-25% for ICSSOA; 30-40% for IHIForum).

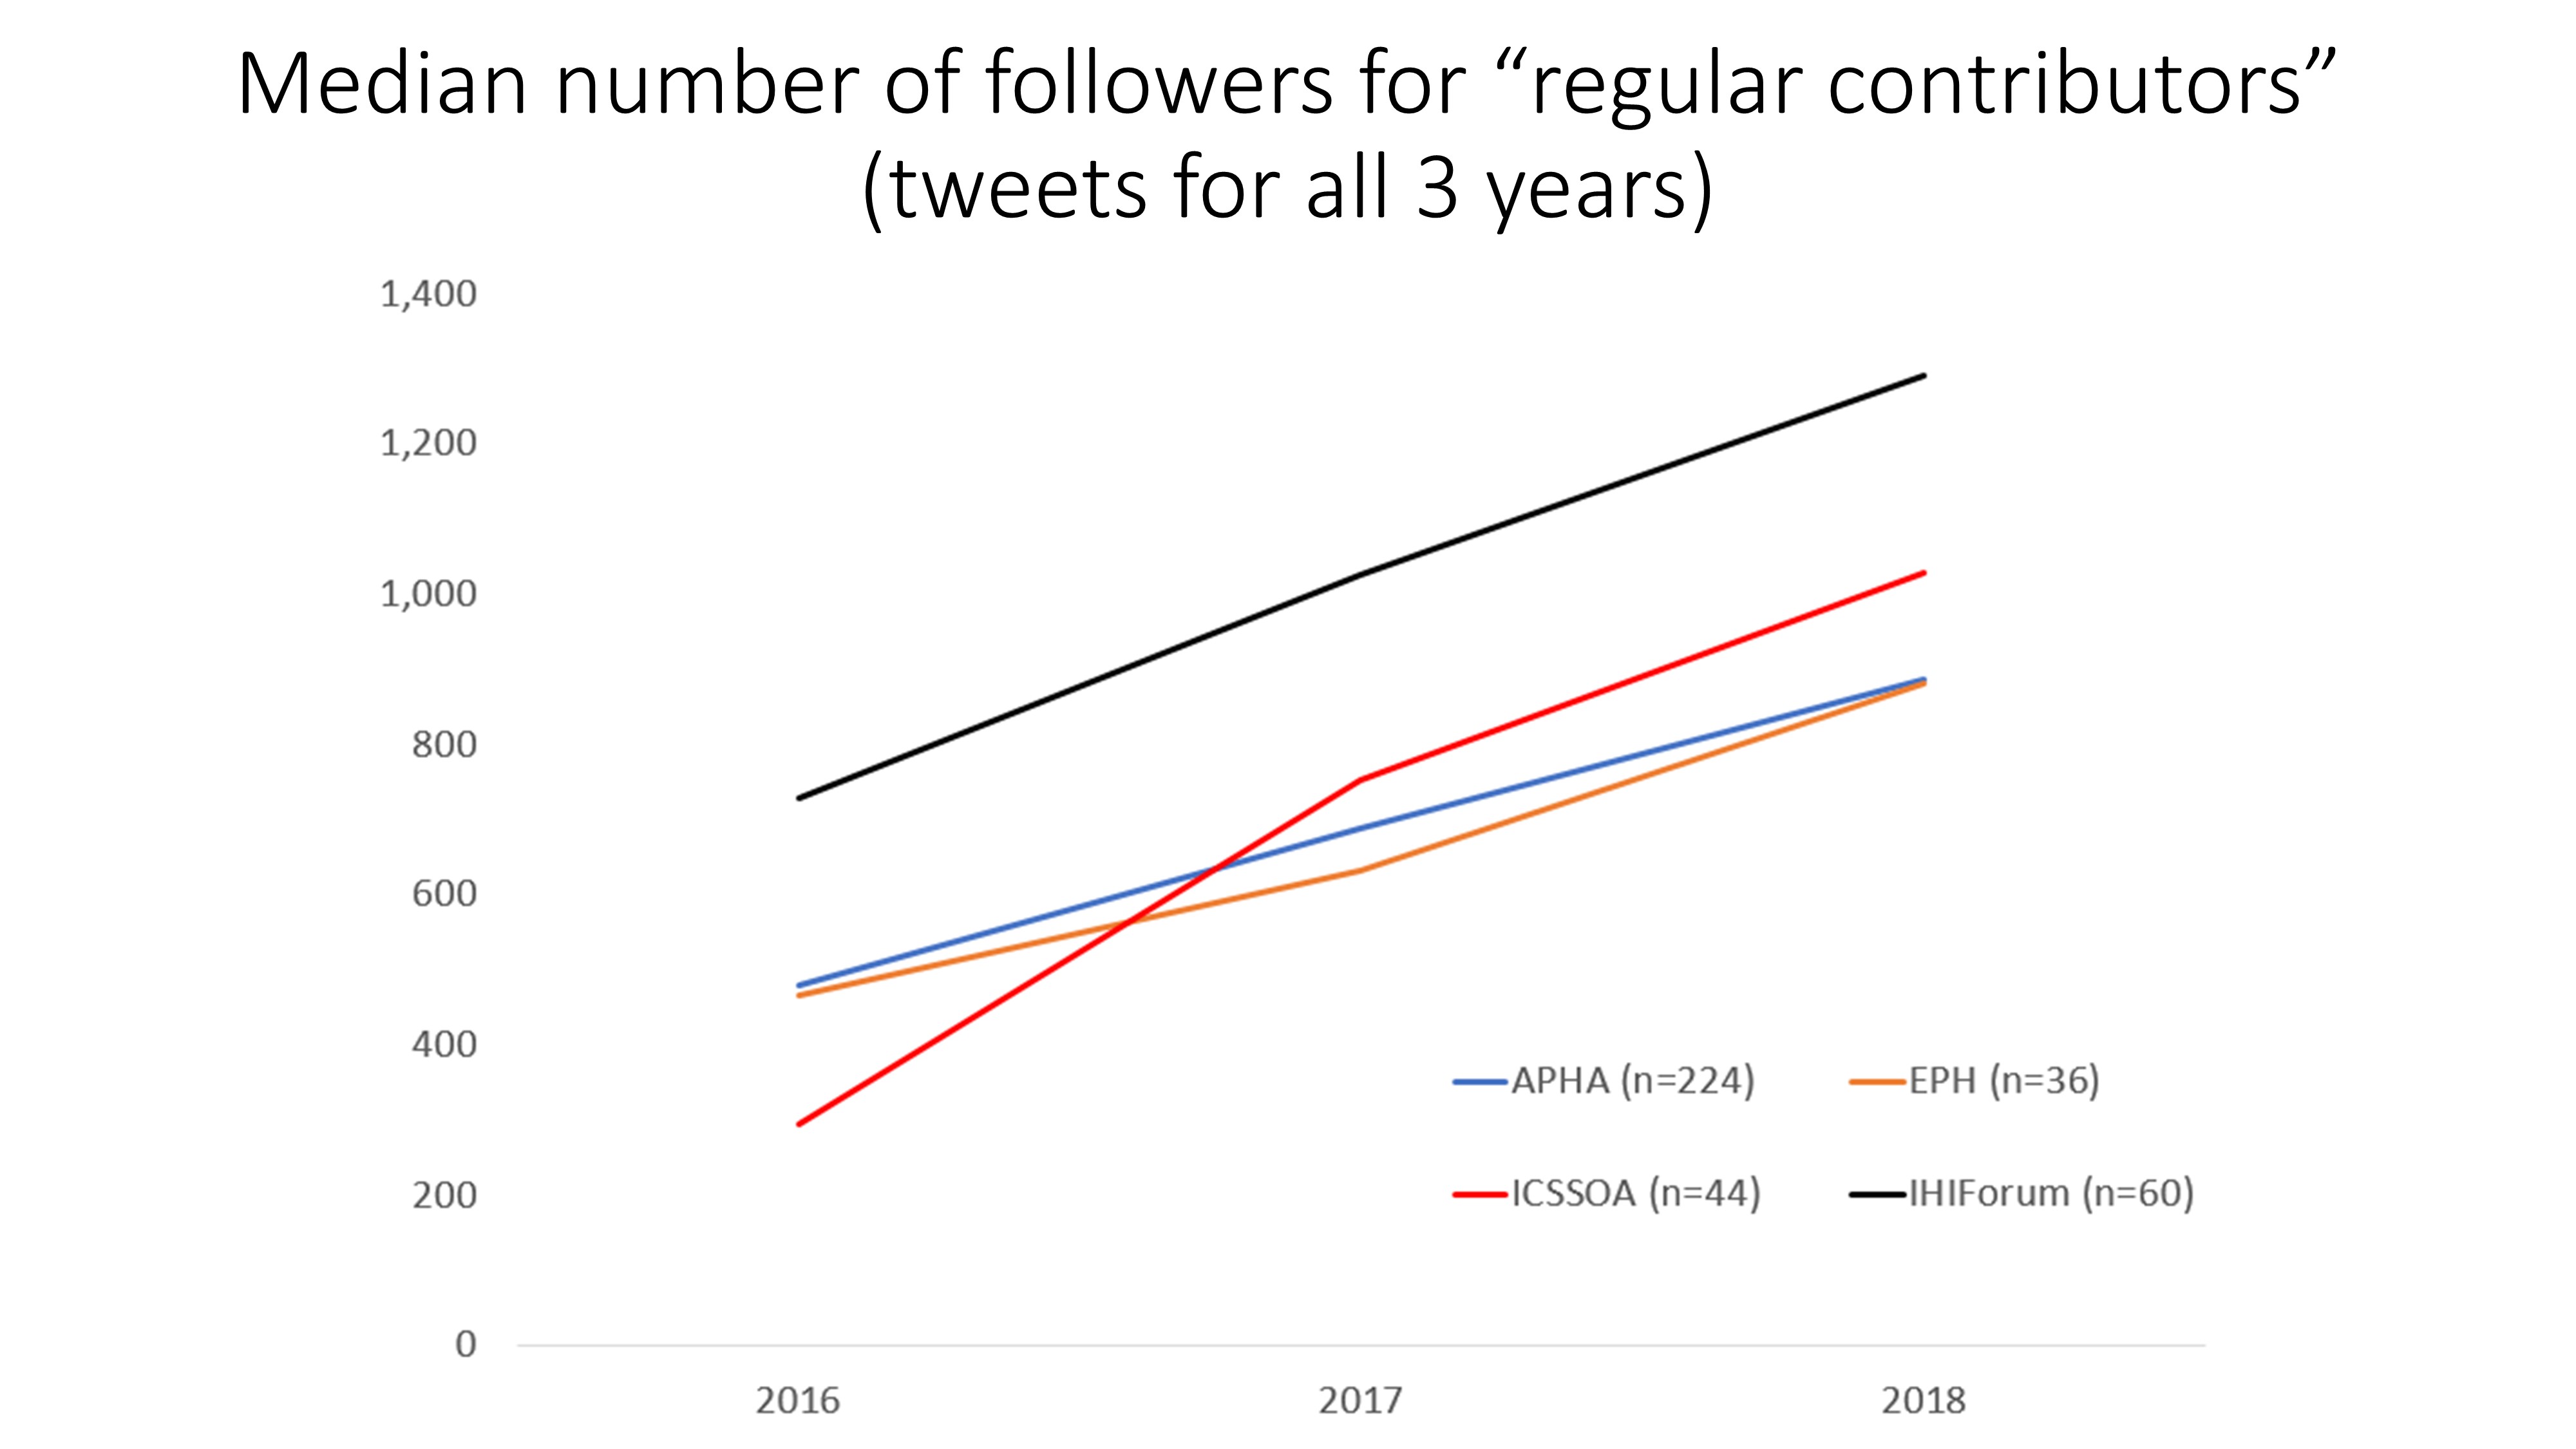
Between 13-15% of tweeters at each of the 2018 conferences also contributed to the previous two years. This minority of tweeters – “regular contributors” – had more followers for each year between 2016 and 2018. While ICSSOA regular contributors had a 3.5 fold increase (250% rise) in median number of followers, the other conferences had a more modest increase (APHA 84% rise, EPH 89% rise, IHIForum 77% rise).
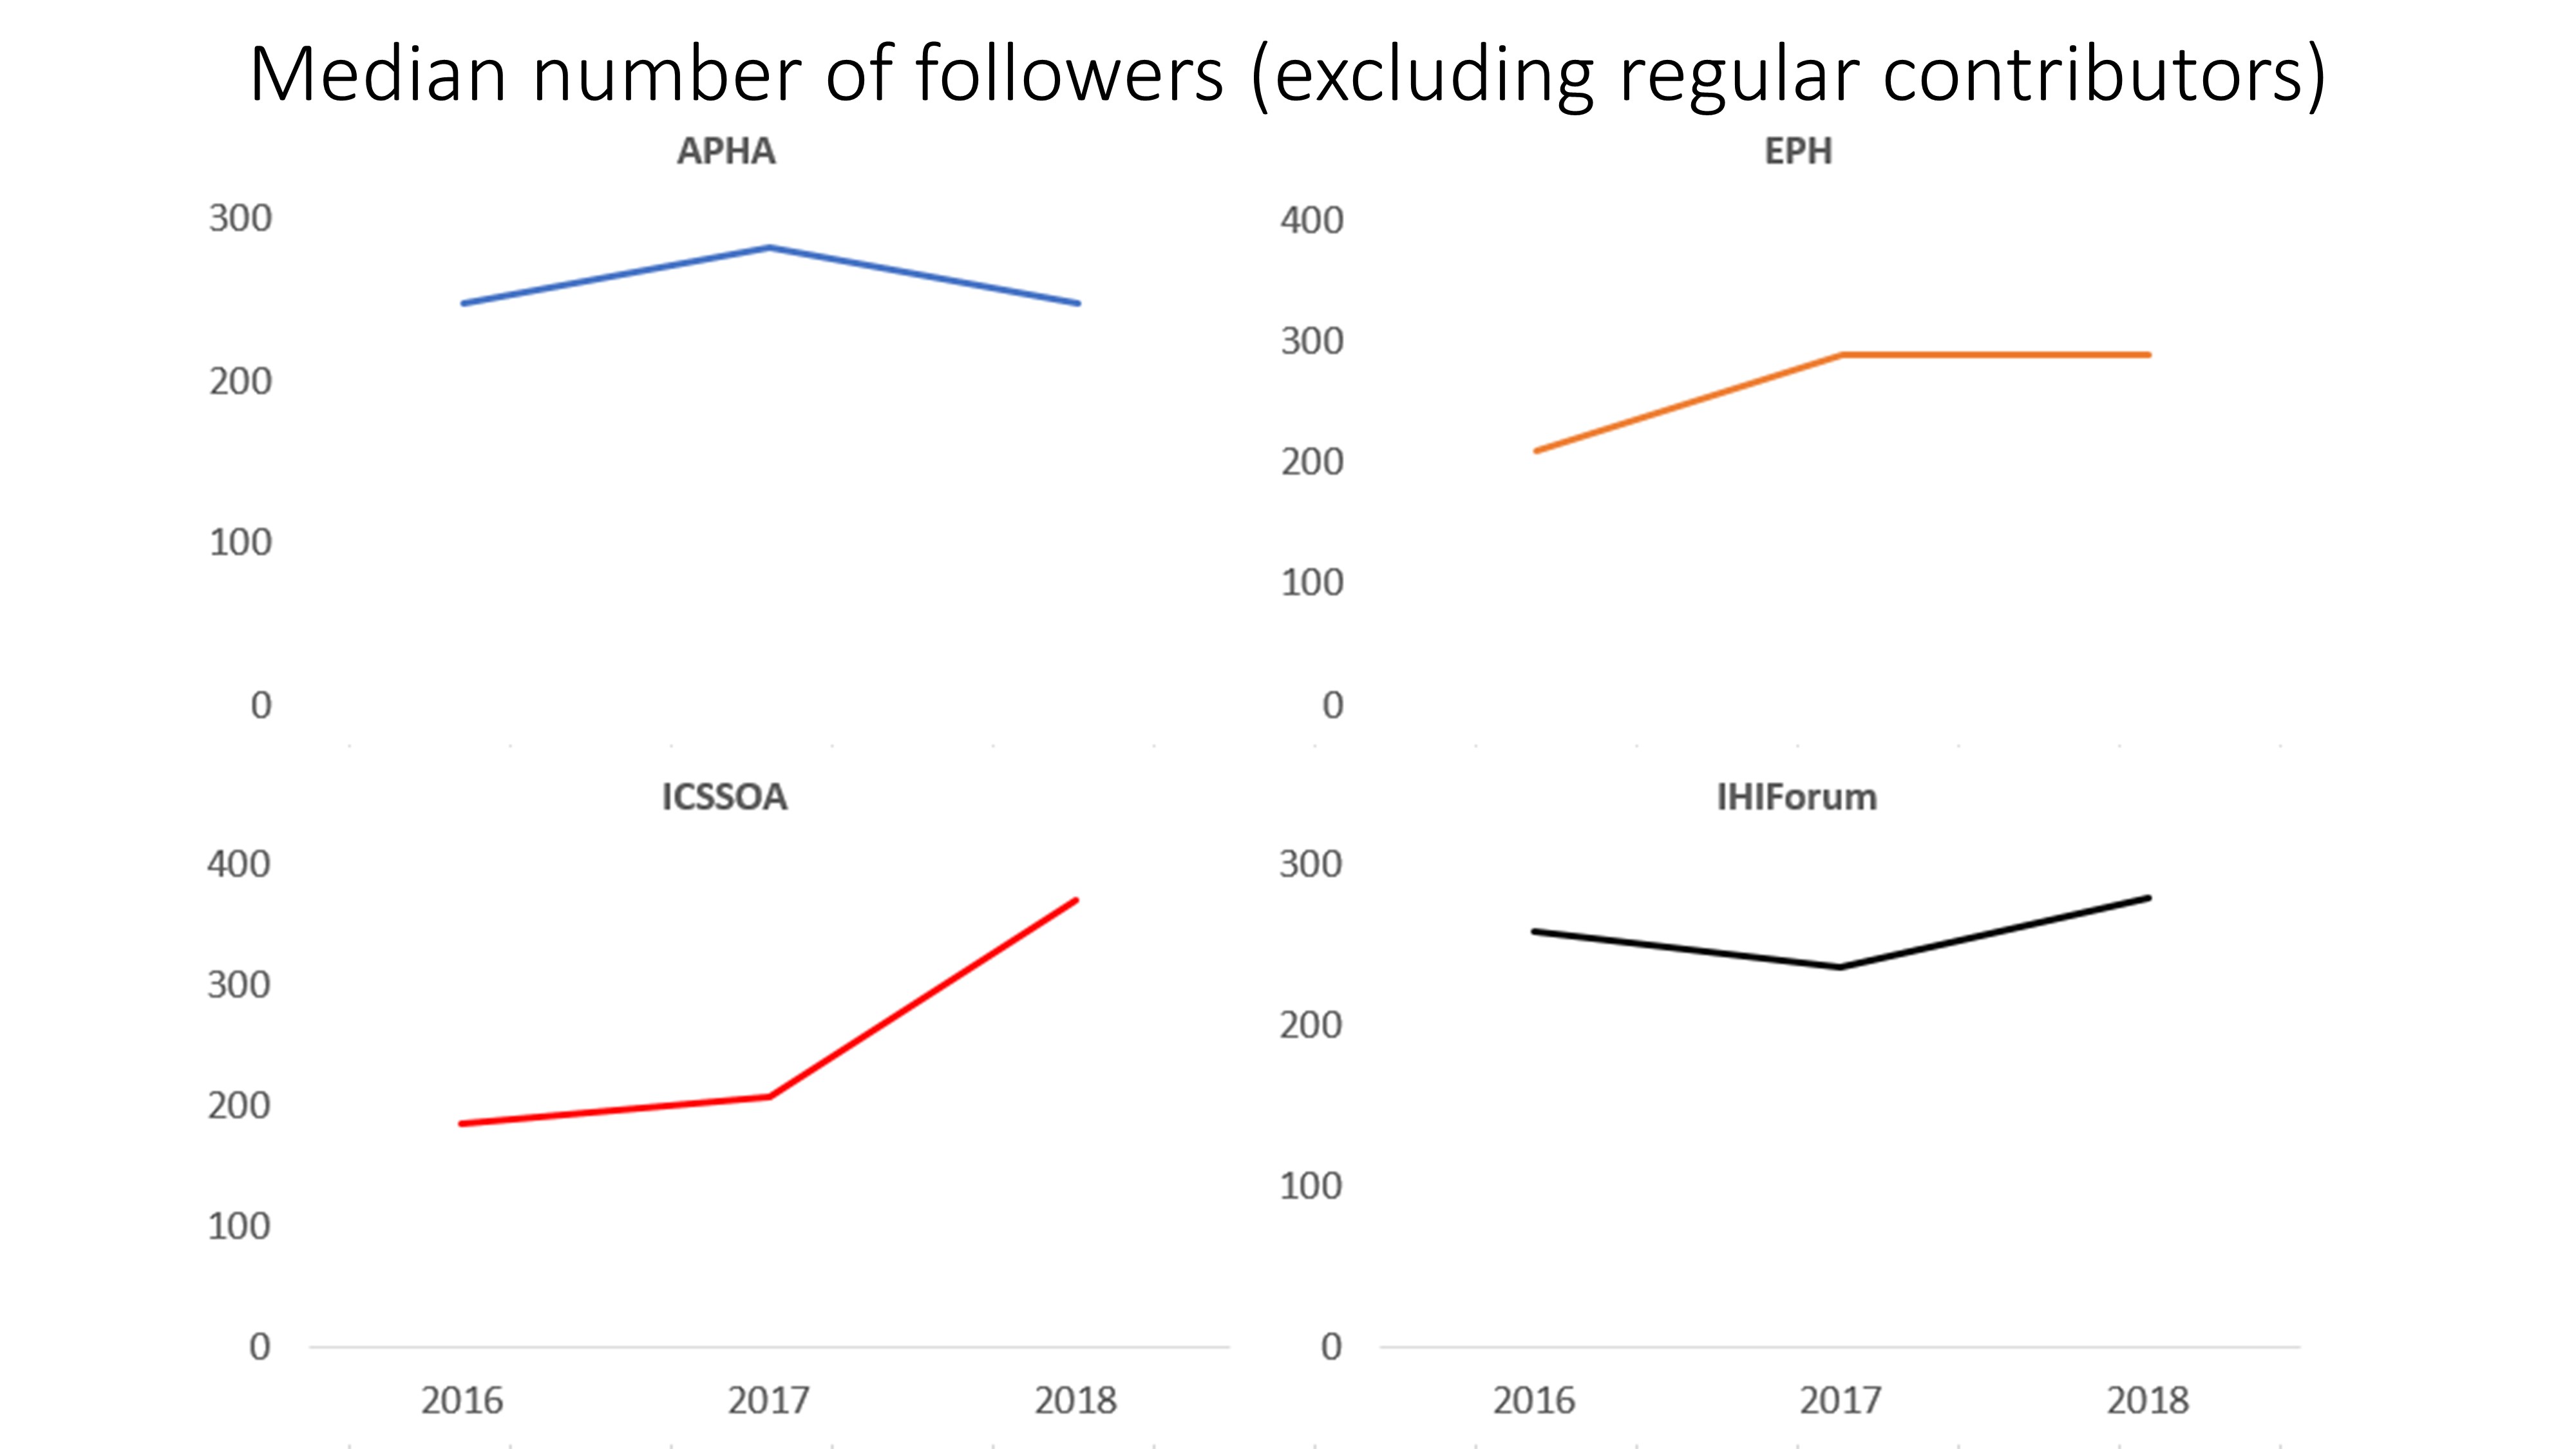
Looking at the rest of tweeters however, only EPH and ICSSOA tweeters had an increase in number of followers between 2016 and 2018 (again largest for ICSSOA), while APHA and IHIForum showed no change overall.
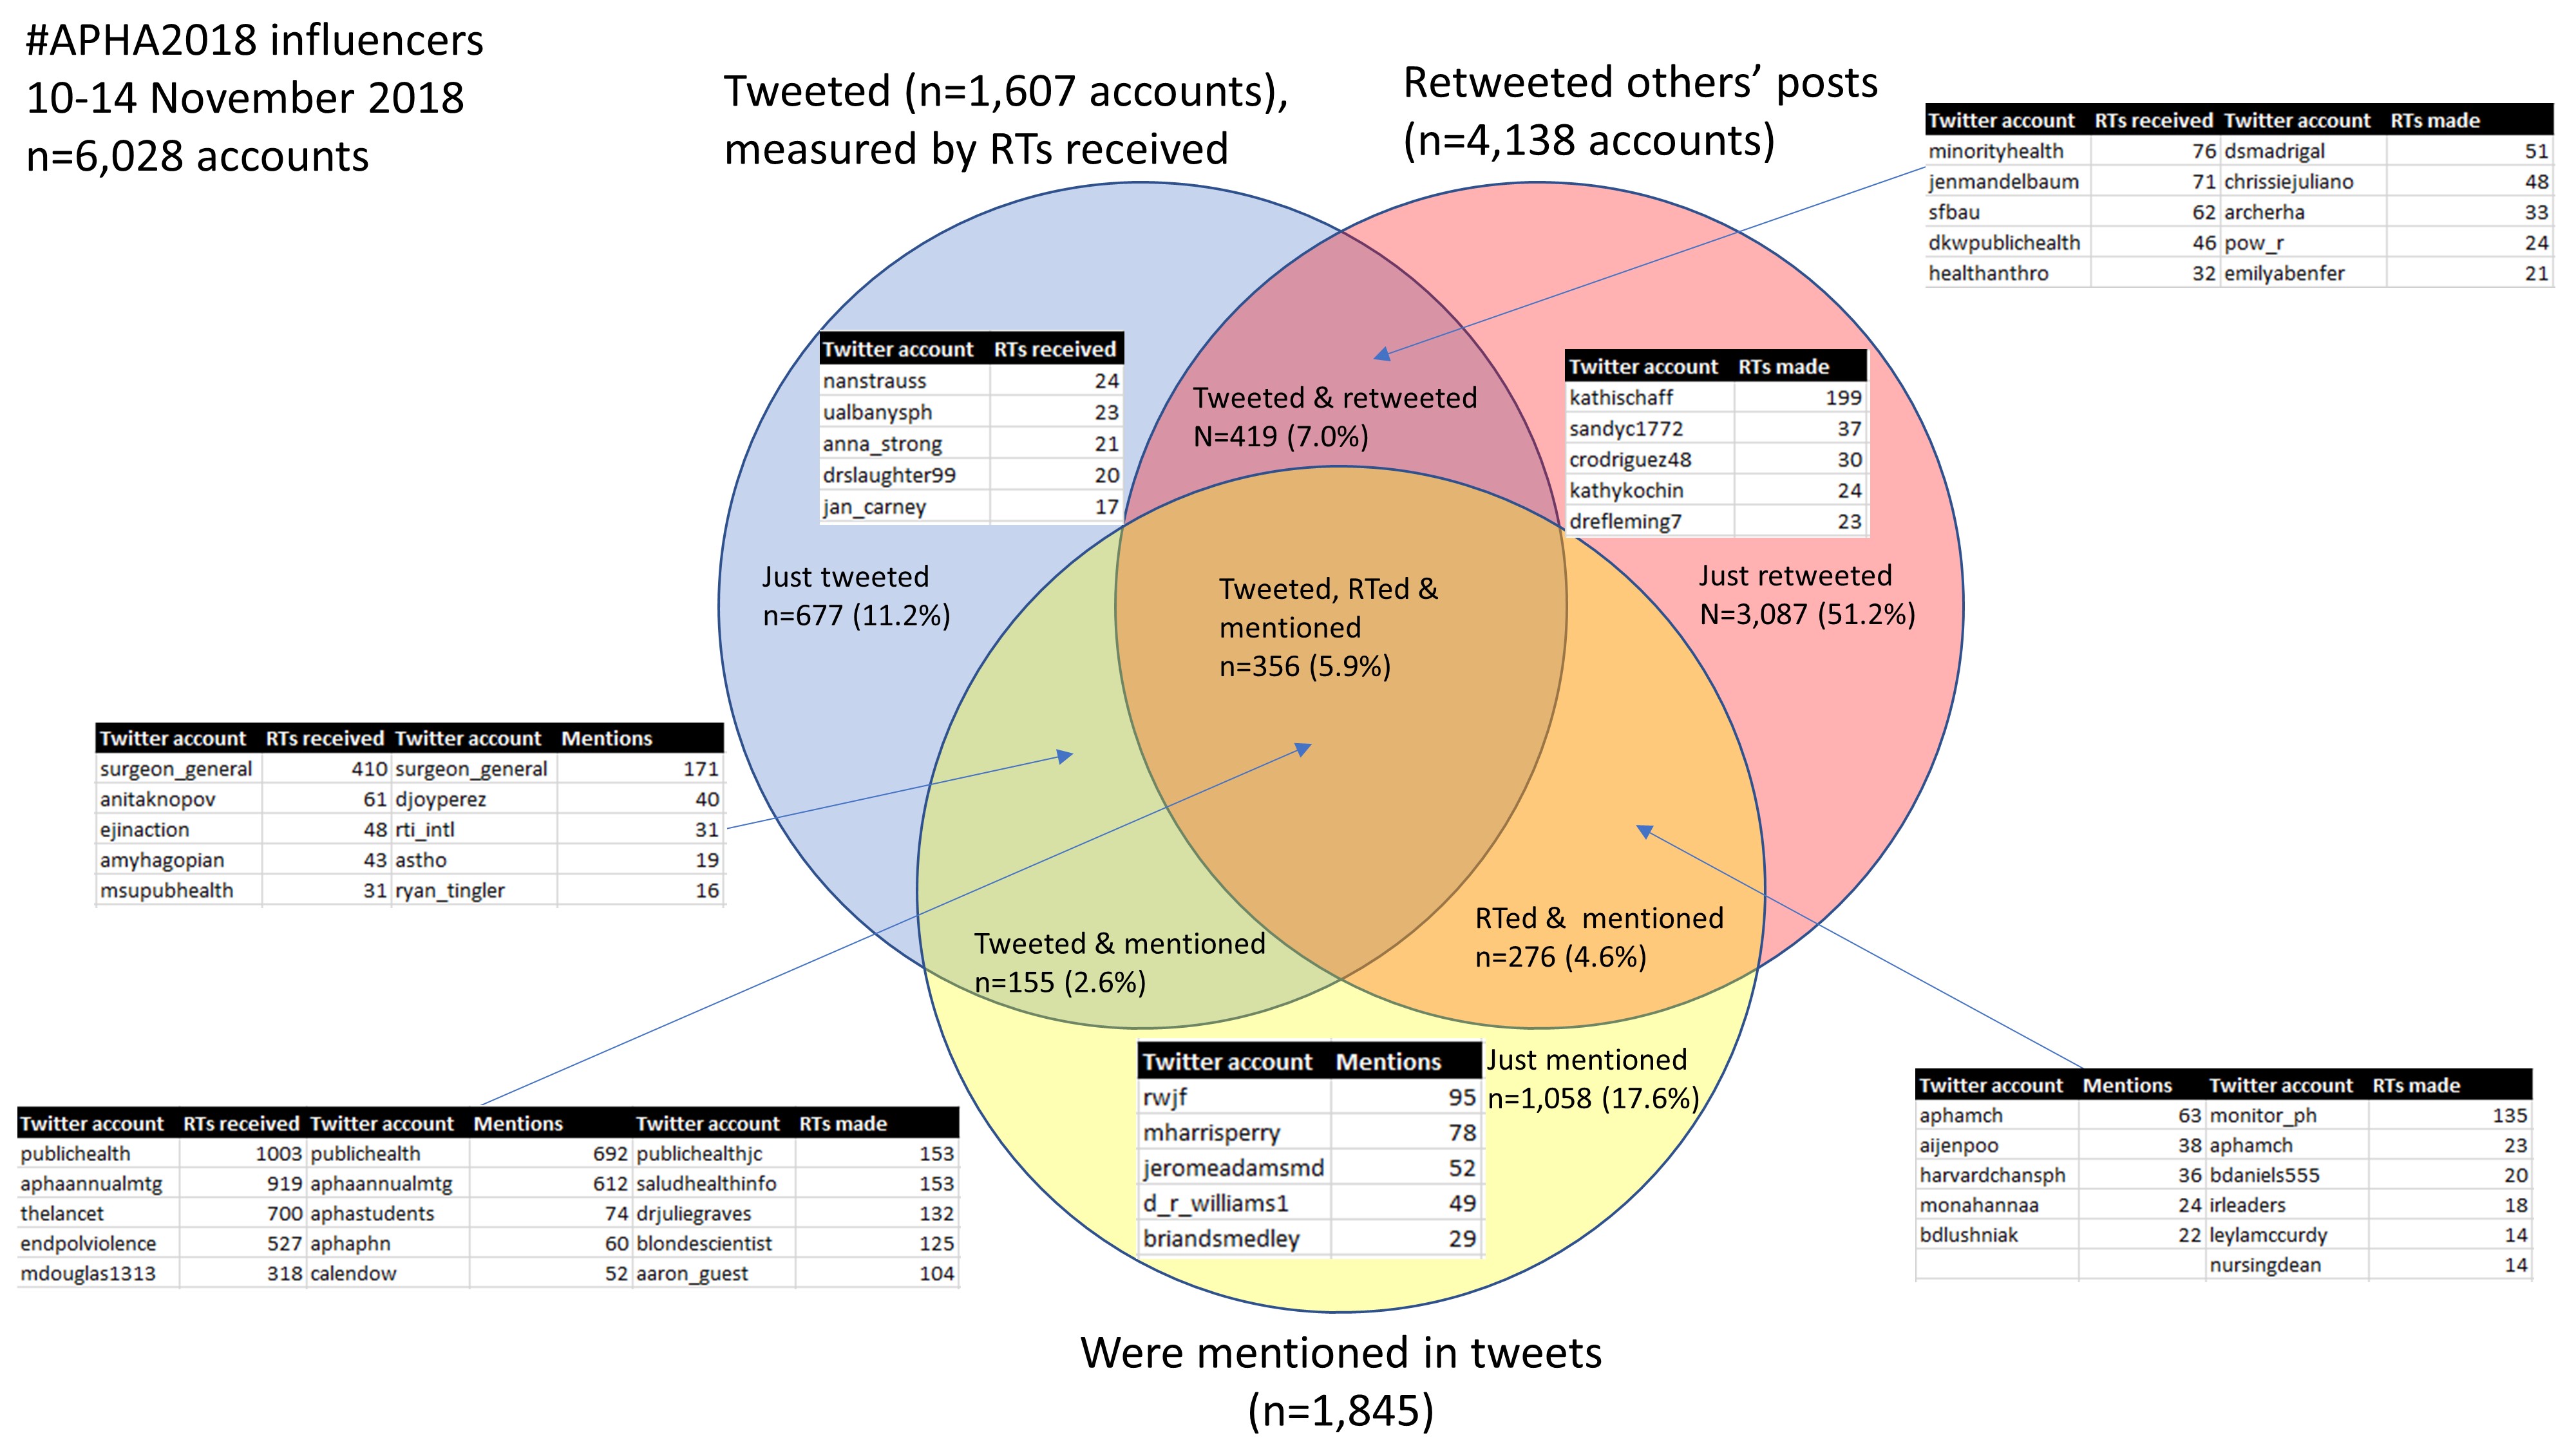
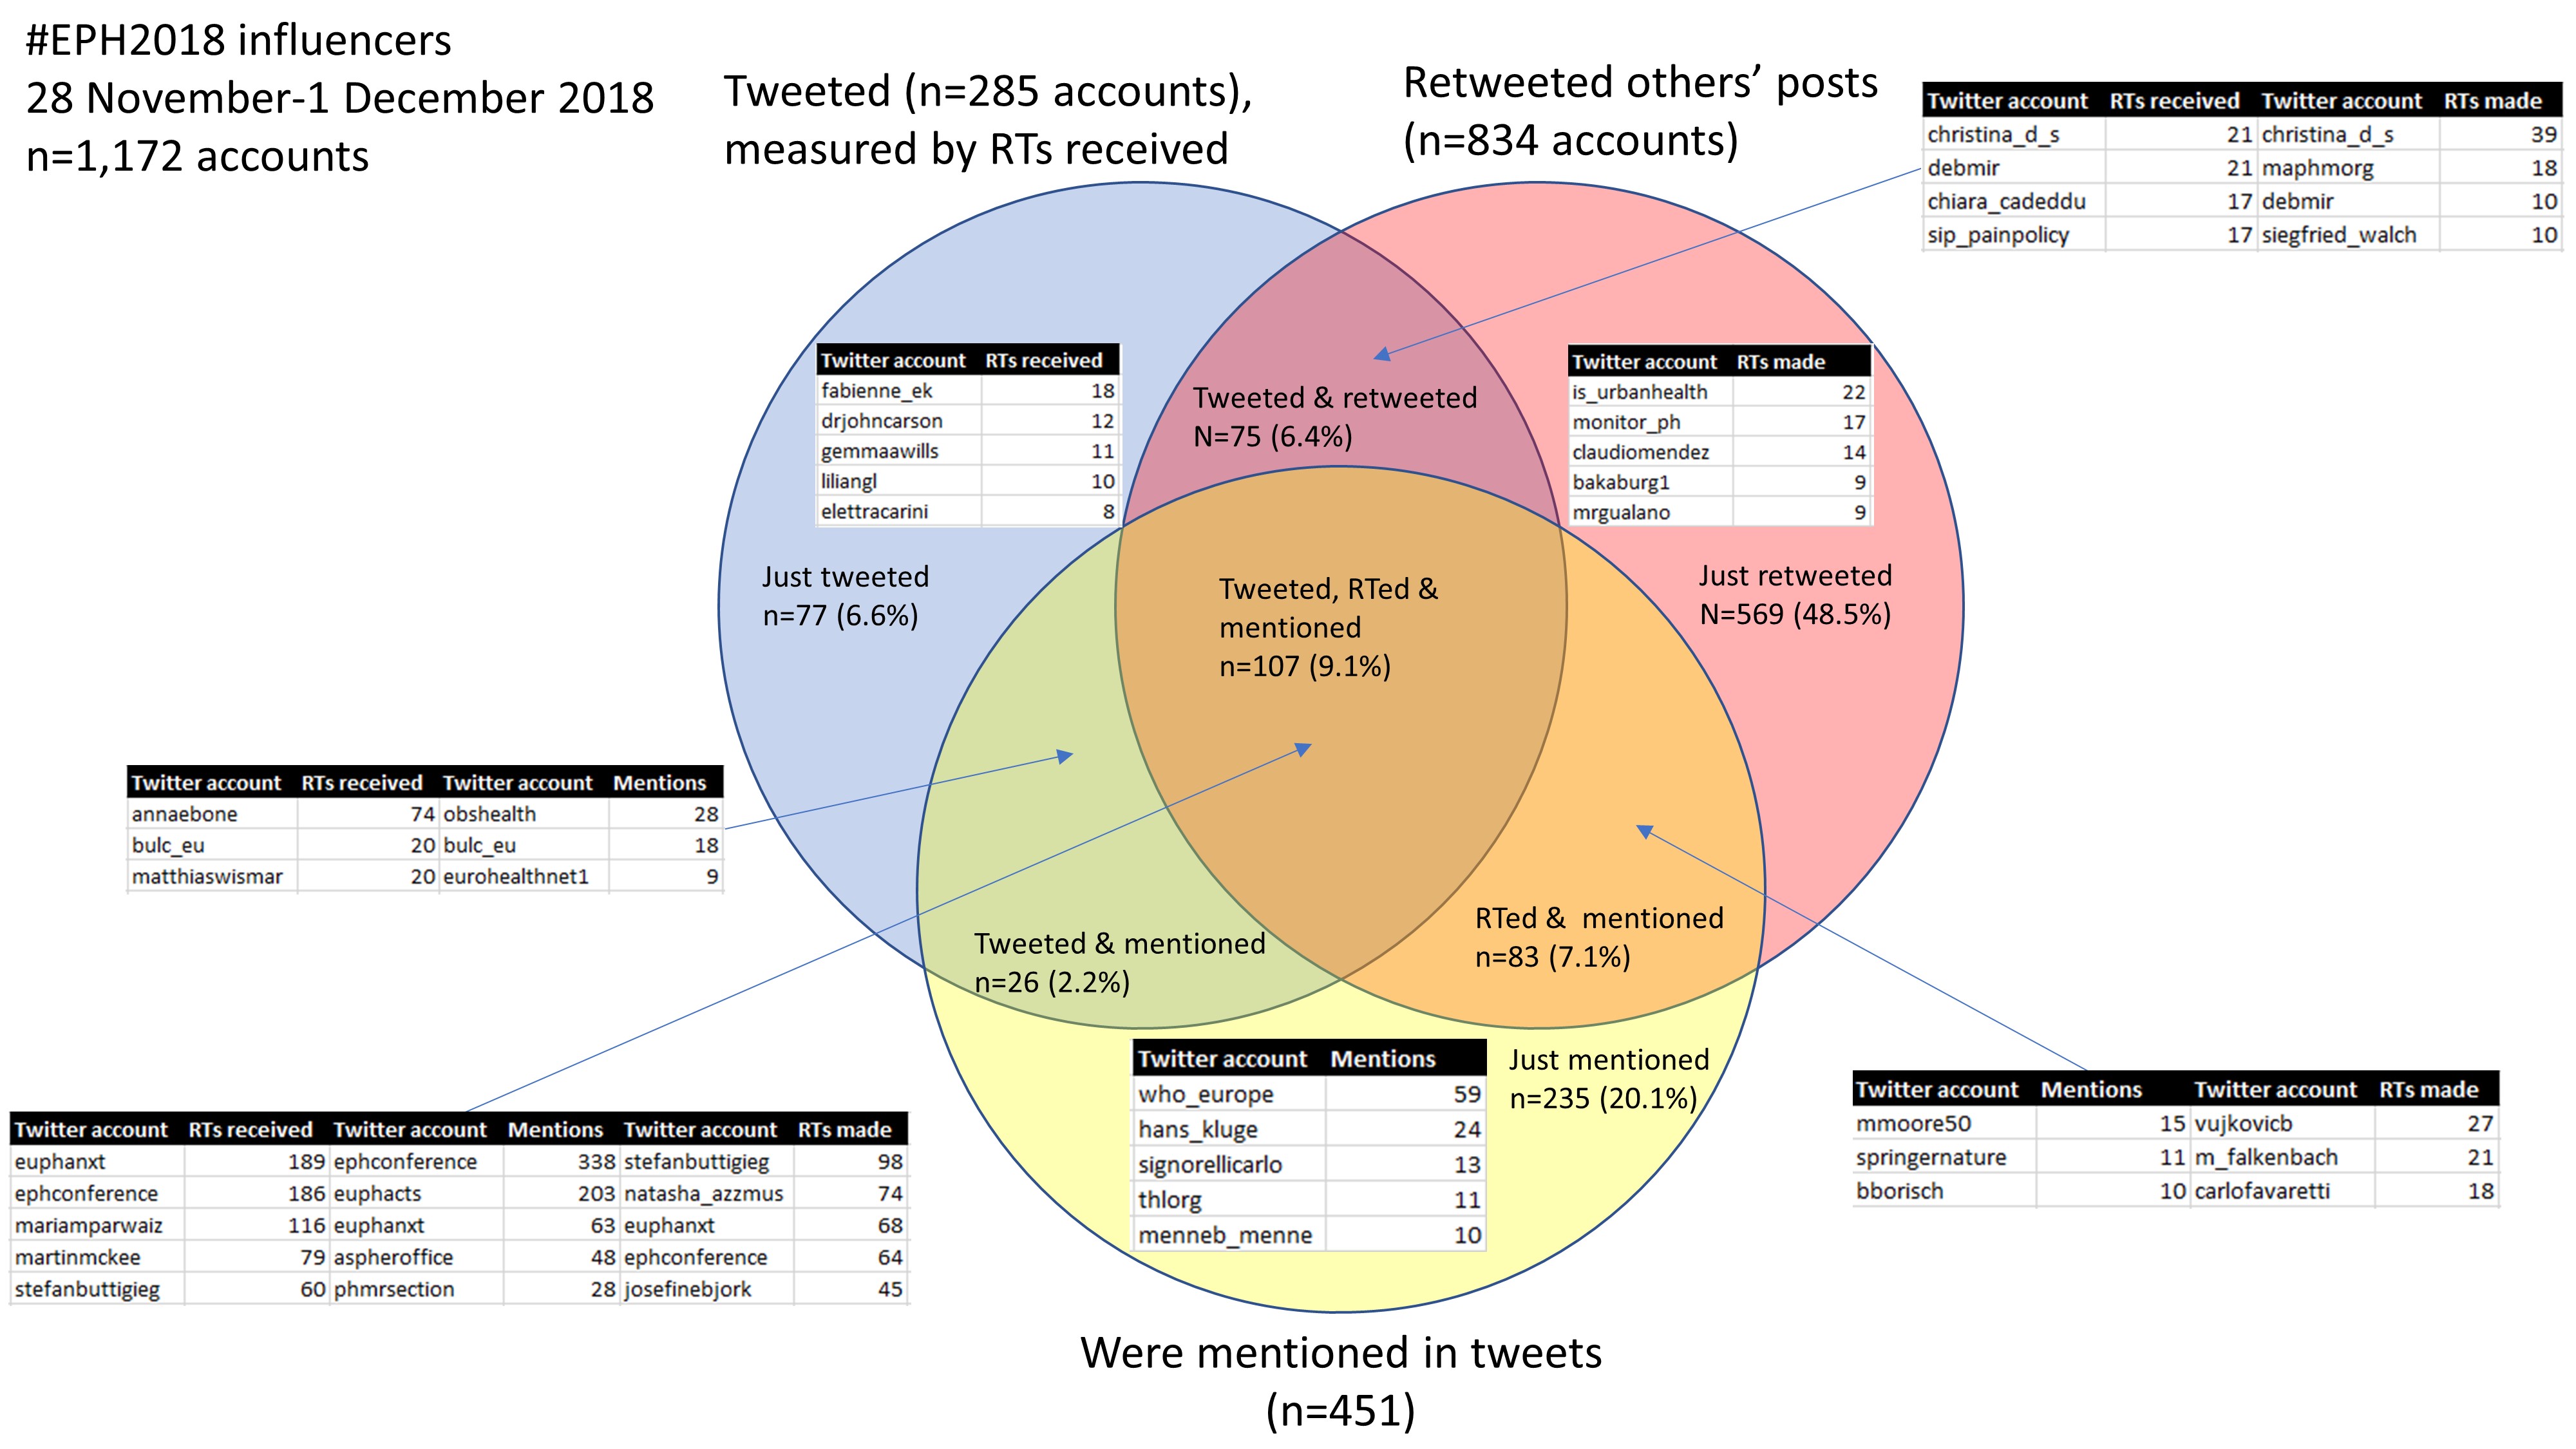
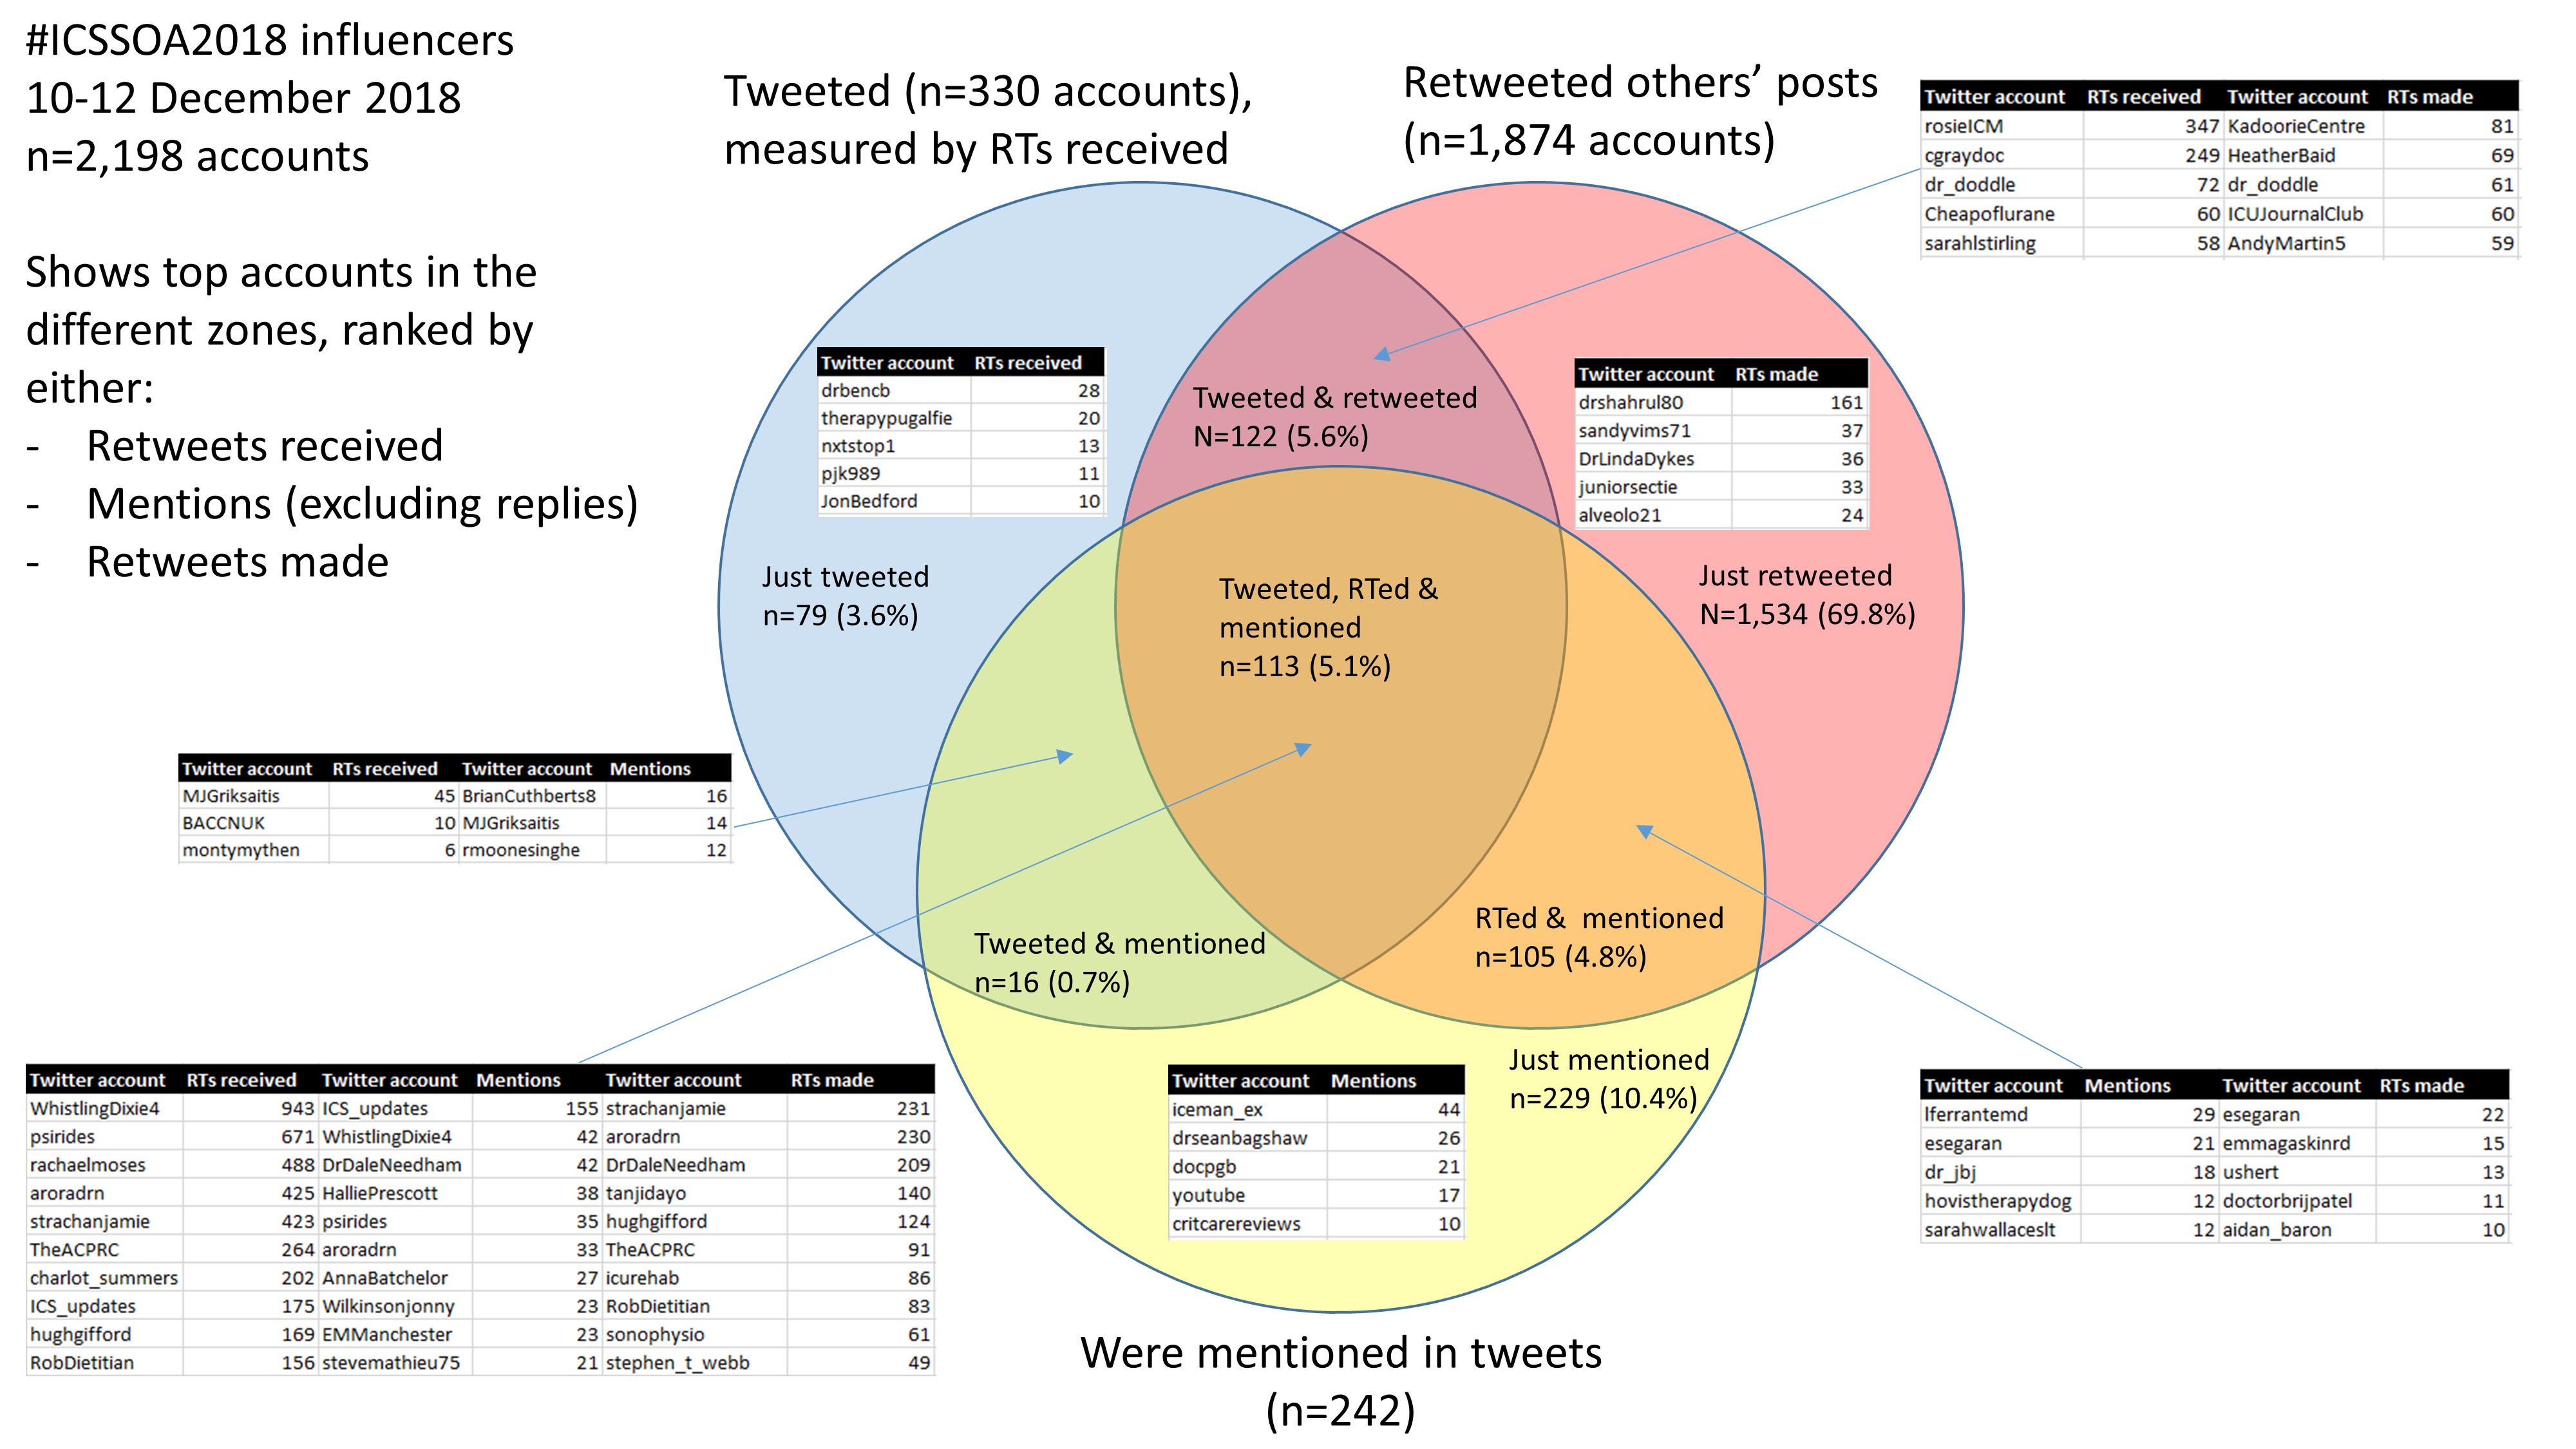
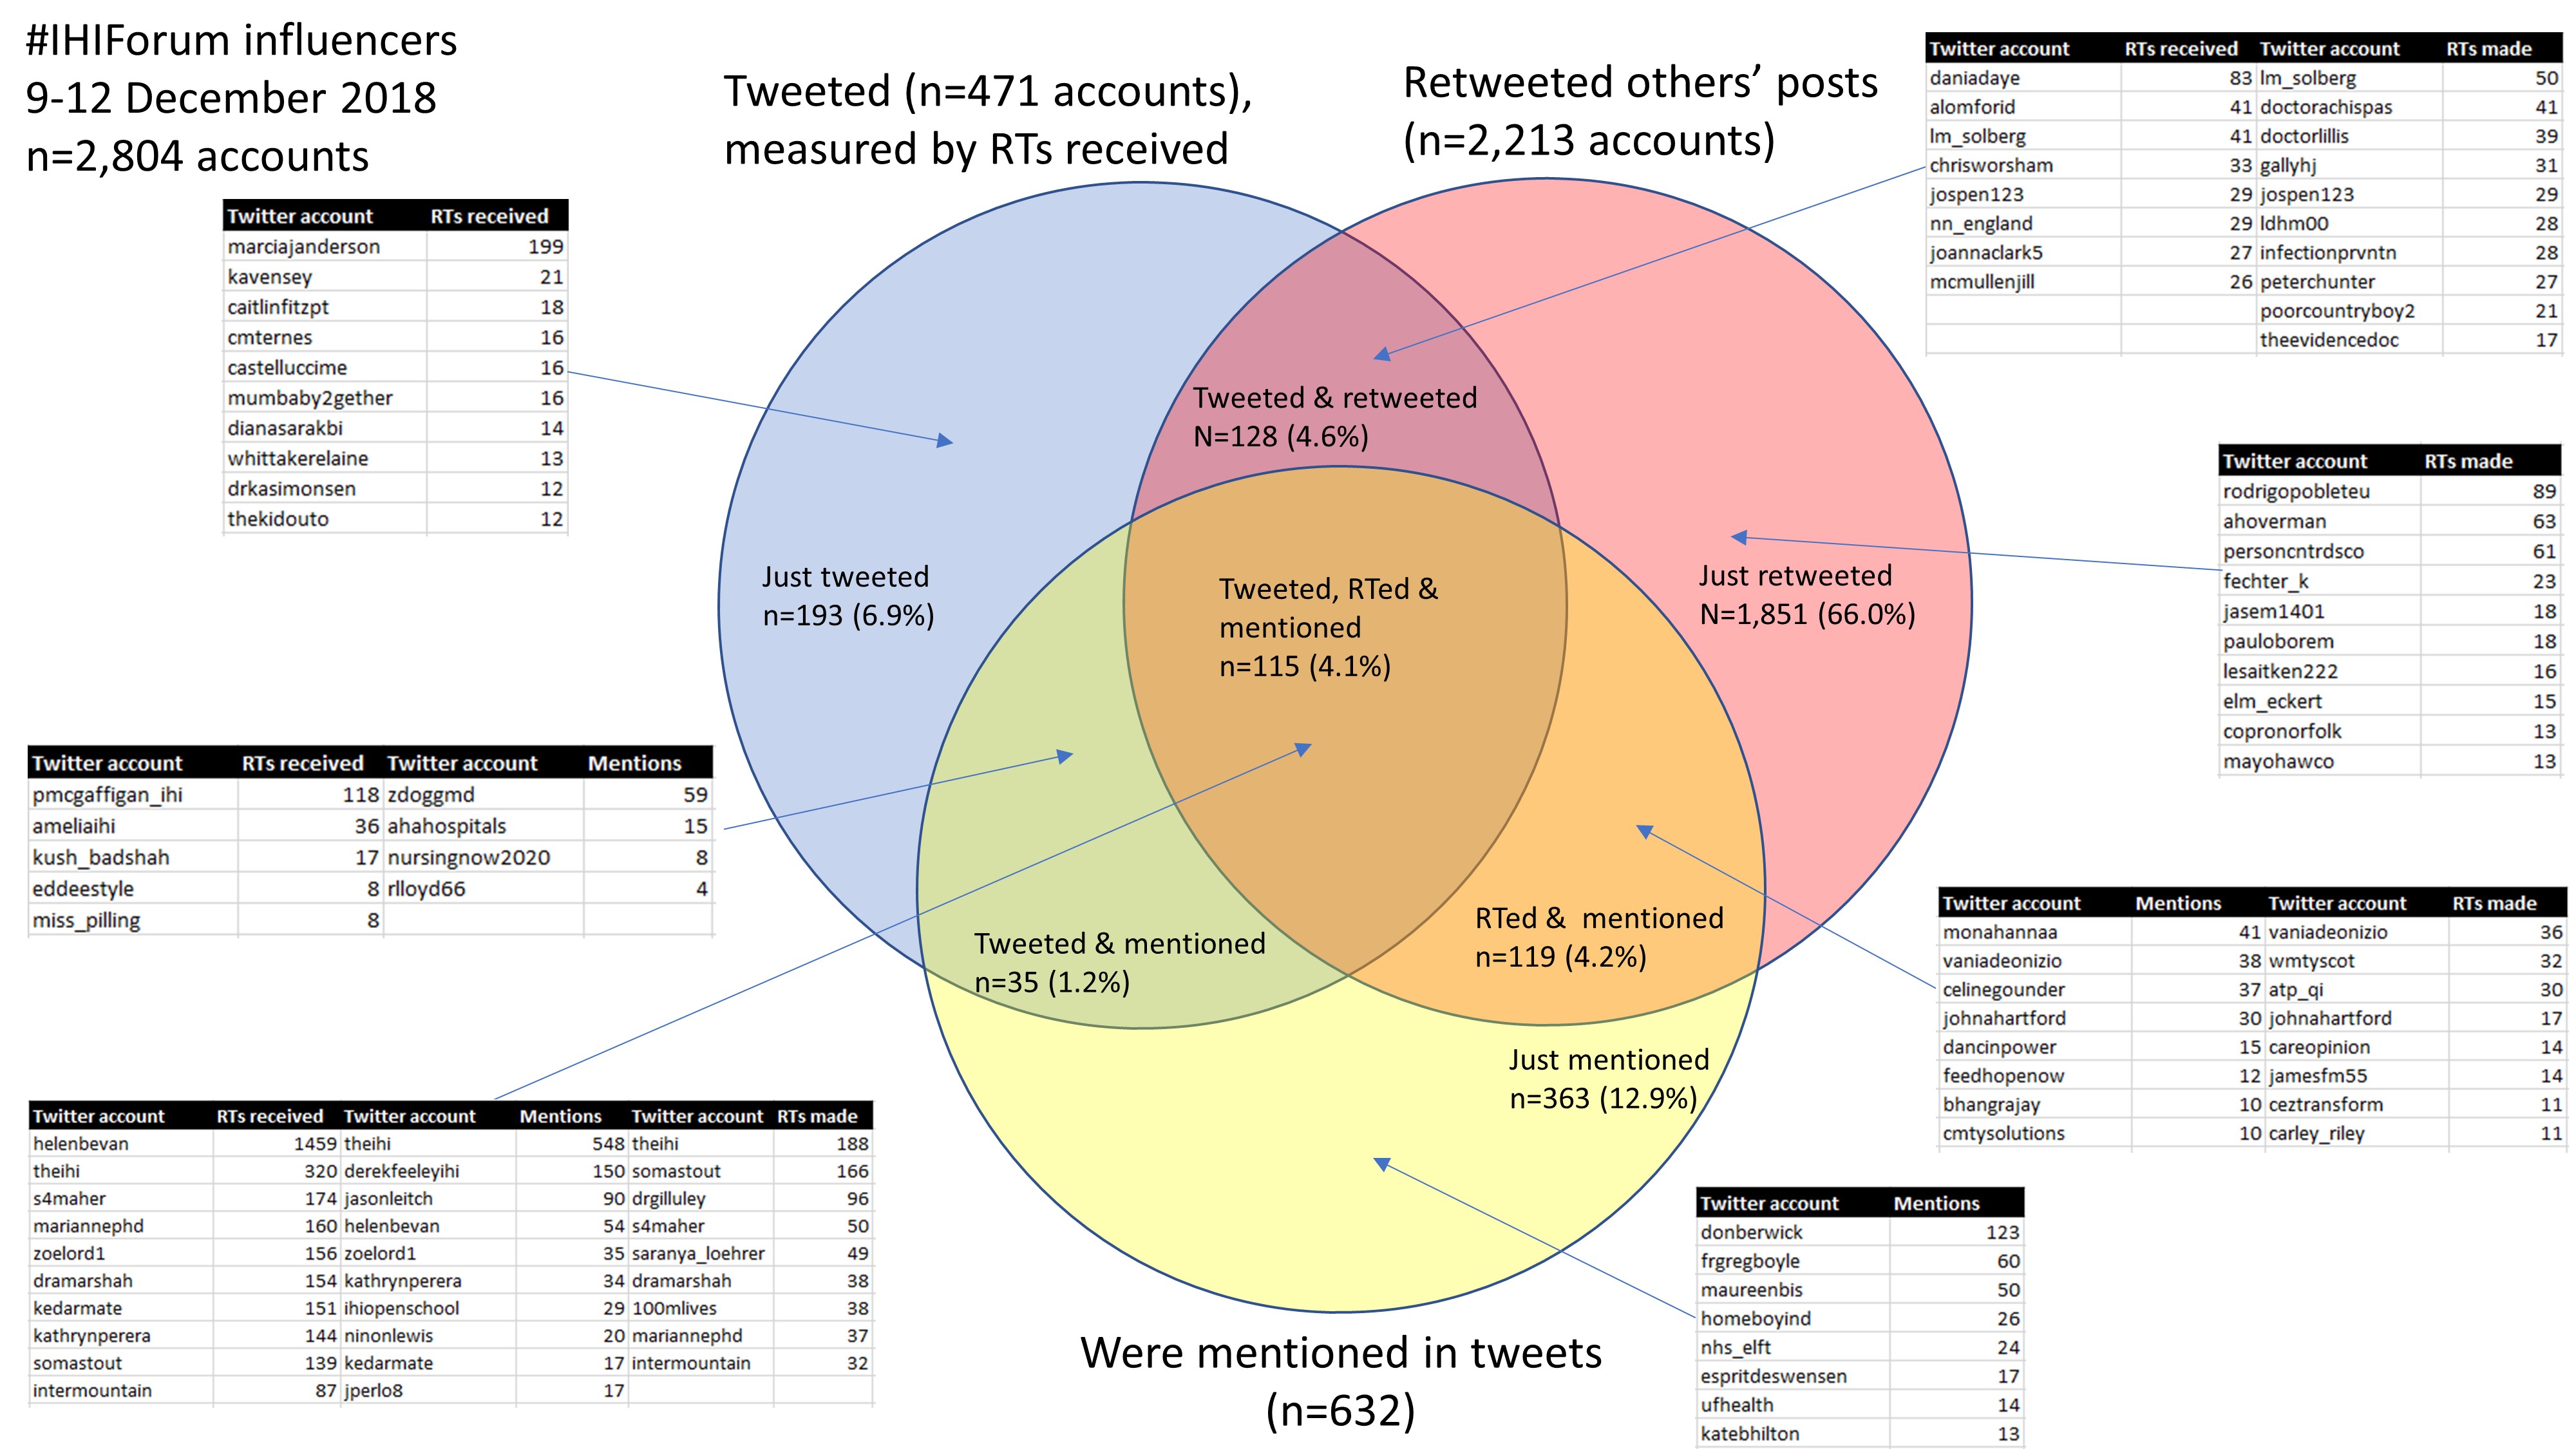
NodeXL data provides additional information that can be used to study “influence” of different Twitter accounts (tweets, mentions by other tweets (specifically excluding replies), retweets). See BJSM blog post for further information on interpreting these Venn diagrams.
The following figures show the top “influencers” in the different categories for the 2018 conferences, using data for the full period of the conference. I have typically listed 5 top influencers per category, but I varied my approach at the different stages of producing these summaries. “Just retweeters” was consistently the largest single category (range from half to over two thirds of accounts). “Just mentioned” was consistently the second largest category (range from 10-20%). The most influential category in the middle of the Venn diagram (accounts that tweeted, were mentioned, and retweeted) ranged from 5-10% of tweeters. Comparing retweets received with retweets made typically reveals a quite different ordering.
Discussion: This analysis has explored the nature of conference tweeting over 3 years, across a range of healthcare related disciplines. It quantifies the contributors, tweets and retweets, and appears to demonstrate a decline in number of Twitter users tweeting at conferences between 2017 and 2018. It also provides access to the most popular content from these conferences in the form of Wakelet summaries, illustrating some sophisticated and informative content.
The differences between regular contributors and the rest of the tweeters may reflect the level of experience in tweeting (both at conferences and more generally), relationships between tweeters in the real world, and/or content of tweets. Many of the tweeters appear to have been relatively inexperienced, with a small number of followers. The largest group of contributors were “just retweeters”, with “just mentioned” in second place. Furthermore, between a fifth and almost a half of tweeters received no retweets (which may reflect the fact that many people will simply view “top tweets” listed by Twitter rather than sifting through the “latest tweets”). This lack of feedback and encouragement may be a disincentive to further tweeting. There are opportunities to improve knowledge of tweeting, as I explore with co-authors in papers being prepared for submission to peer reviewed journals.
Looking at the tweets for the individual conferences, the anaesthetists (ICSSOA) and quality improvers (IHIForum) had the most striking content, with a clear attempt at capturing and curating key findings of the conference. The group of regular contributors to ICSSOA had a more than 3 fold increase in median number of followers between 2016 and 2018, greatly exceeding the rise in number of followers for regular contributors to the other conferences. However, despite this great content, their conference had few tweeters and fewer retweets in 2018 than 2017. There was, however, a linear increase in total tweeters and retweeters between 2016 and 2018 for ICSSOA. Their highly organised approach to conference tweeting is well captured in this early tweet from #ICSSOA2018.
Medical conference tweeting – once a novelty – is entering a more mature phase. There is a stable group of contributors establishing their reputation as reliable sources of information, plus tweeters emerging with strong content, sometimes as a one off. The figures from the conferences suggest that Twitter remains a minority activity, comparing tweeters with conference participants. The greatest body of contributors are retweeting, performing a useful function in dissemination, but it would be great to see them providing original content of their own as well. There are plenty of areas to establish new relationships, support new contributions, and encourage big corporate tweeters to support individual tweeters – for example the large “just mentioned” group in each Venn diagram. Tweeting takes effort, and there is an opportunity cost. Conferences are busy: in addition to attending programmed sessions there is a lot of moving between rooms, finding time for meals and refreshments, socialising, poster reading, tweeting and retweeting. With all these competing activities it is not surprising that prominent tweeters tend not to have been among the top retweeters, and vice versa. It would be unrealistic, therefore, to see people listed in all the top influencer lists in the central zone of the Venn diagrams. Understanding and monitoring the number of Twitter accounts in the different zones will provide a way of quantifying the level of connectedness, ideally increasing the zones towards the centre of the Venn diagram.
Recommendations for further work:
Twitter should provide access, in aggregate form, to accurate data on Twitter impact, as provided already for individual users via Twitter Analytics . I have not attempted to estimate reach (“impressions” or “audience”) in this blog. Some tools (Symplur, Twitonomy, Followthehashtag) attempt this, typically by multiplying number of tweets posted by number of followers. The details are important, as each of these tools treat tweets and retweets as “tweets”. They also assume that all followers will see the tweet. These two factors lead to a very substantial overestimation of impressions, as illustrated in this analysis of a short period of tweeting via Symplur (ICSSOA2018 tweets), compared with official Twitter Analytics data: Symplur overestimates impressions 14-15 fold. I have witnessed even higher “impression inflation” in other contexts.
Tweeters and retweeters are sometimes under-represented in NodeXL maps: The following map shows tweeting from #ESCCongress 2018, as written up in BMJ Heart with Sarah Hudson. Each profile picture represents a Twitter account that either tweeted, replied, was mentioned and/or retweeted. In general the map shows a “tight crowd” pattern of tweeting (right of image). NodeXL explains this as follows in each of the reports on its graph gallery:
There is an edge for each “replies-to” relationship in a tweet, an edge for each “mentions” relationship in a tweet, and a self-loop edge for each tweet that is not a “replies-to” or “mentions”.
The left of the figure (G1) shows apparently disconnected “tweeting” (which in this context also includes “retweeting”).
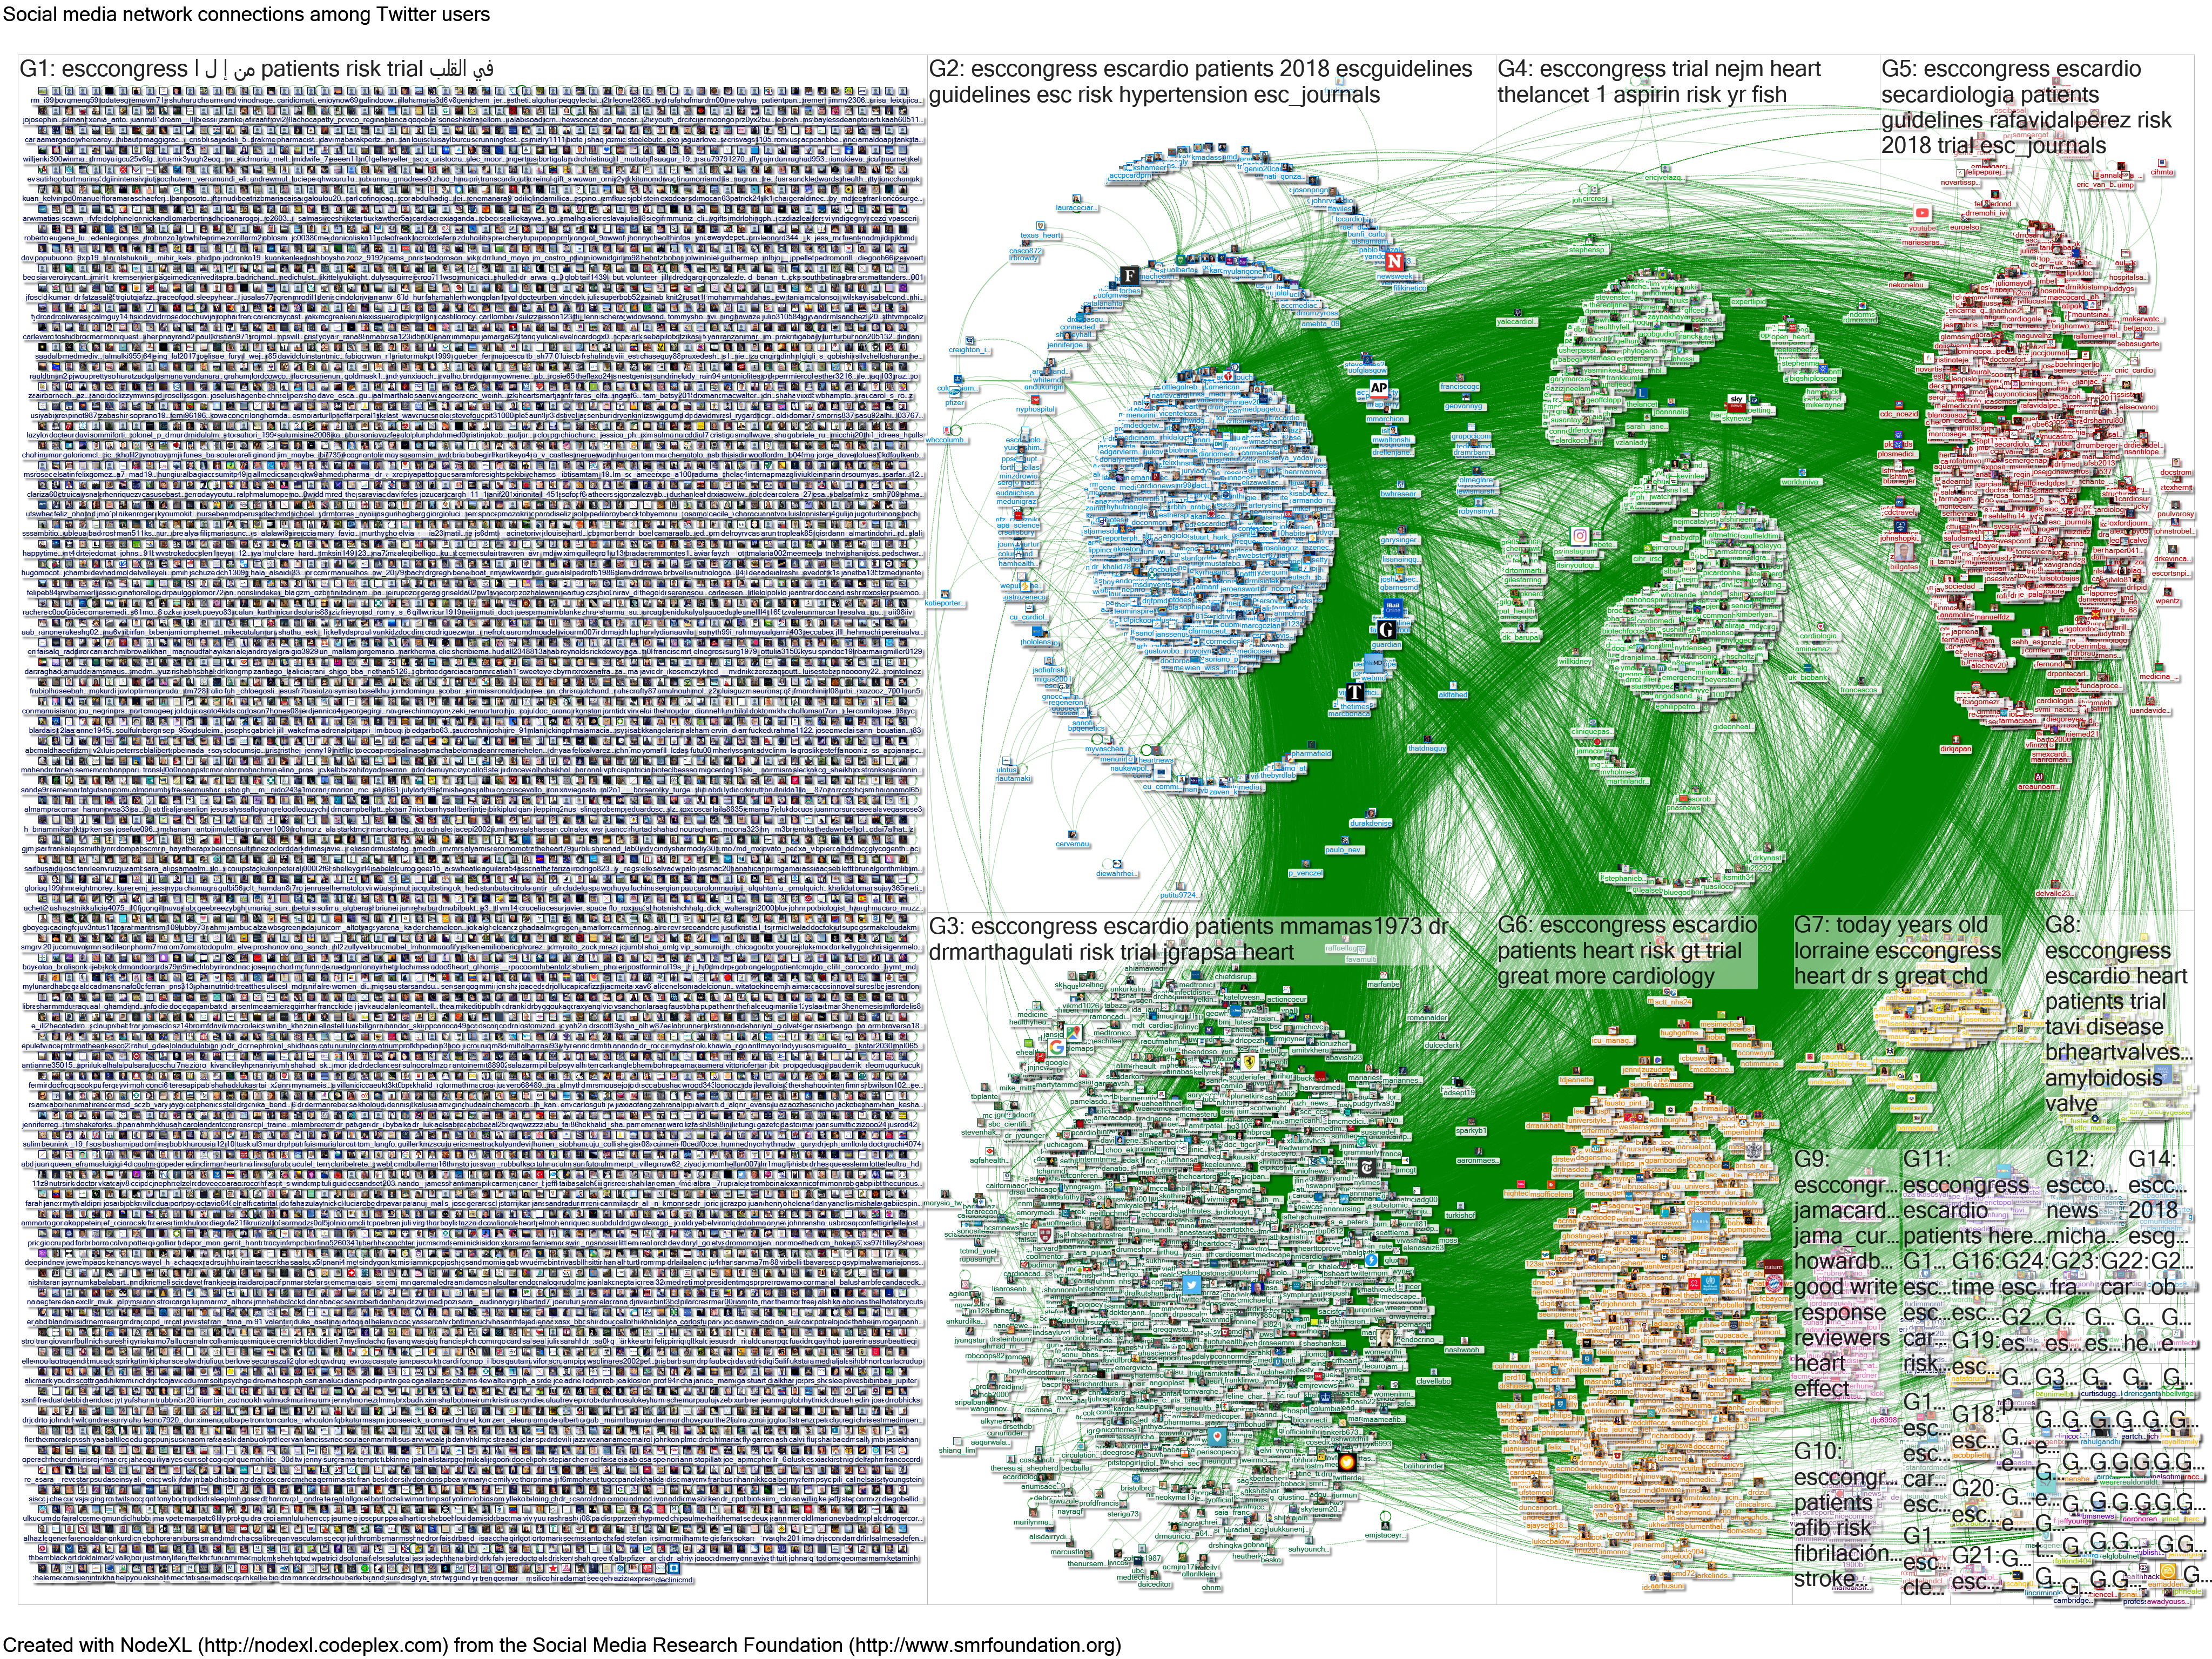
In fact, the great majority of the tweeters and retweeters were connected with other tweeters on the maps, but not in a “replies-to” or “mentions” relationship. When I explored this further using the NodeXL extract I found 4,923 accounts in G1: 4,671 (94.9%) just retweeted, 217 (4.4%) just retweeted, and 35 (0.7%) tweeted and retweeted. Of the tweeters (n=252), 153 (60.7%) received retweets from their 617 tweets. Overall, therefore, 98% of accounts shown in G1 retweeted or were retweeted. In one particularly striking example, an Arab language tweet was retweeted 911 times, the majority from G1 (n=767 retweeters). The tweet did not mention other Twitter accounts. This tweeter appears in G44 on the map (bottom right) rather than G1 because a response to this tweet used the conference hashtag. Drawing 900+ green lines connecting G1 to G44 would change the map very considerably. I would argue that retweets are as relevant a connection as a mention or reply, and sometimes retweets are more important as they demonstrate that the tweet has been read (or identified by Twitter-bot), and there has been a decision to share the post. In contrast a “mention” is frequently not reciprocated as illustrated by the Venn diagrams above.
Approaches to capturing replies should be explored. The majority of responses to conference tweets are currently missed, as they will typically omit the conference hashtag. An illustration of this is shown in an analysis of #SoMe4Surgery tweets (a campaign rather than conference). In that analysis 28% of replies used the hashtag. In conference tweeting the figure is typically even lower. By relying on hashtag searches we are only describing the surface of conference tweeting. There is potentially a lot of valuable information lost by ignoring replies. I explore this further in a forthcoming report on the EndPJParalysis campaign.
Social media tools, including NodeXL, do not currently capture replies without a hashtag (or other selected search term), and nor do they document the number of replies. This information needs to be extracted manually by viewing individual tweets, which can be very time consuming, even after producing Wakelet summaries of top tweets. Replies are not displayed in such summaries. For example in the following tweet from IHIForum 2018 Wakelet displays “30 people are talking about this”, while it should really state “23 people retweeted and 7 people replied”. Indeed, Twitter itself under-reports the number of replies – adding in replies to replies frequently finds additional responses unrecorded in the “replies” count.
And with that, I am signing out of social media analysis for the foreseeable future. I look forward to applying some of these techniques to GP tweeting in due course, but for the time being I will be using my evenings and weekends to hit the books and study guides, and my days (and some nights) working as a GP trainee.
Signing off as Consultant in Public Health Medicine, 5 February 2019
Dr Graham Mackenzie, GP ST1

awesome work, much needed evaluation of the real impact somed has at conferences. I admire your flexible approach to a career in health care, best wishes with the next stage.
LikeLike