
This is a page to hold information about my analysis of #SoMe4Surgery tweets.
Here are the principles:
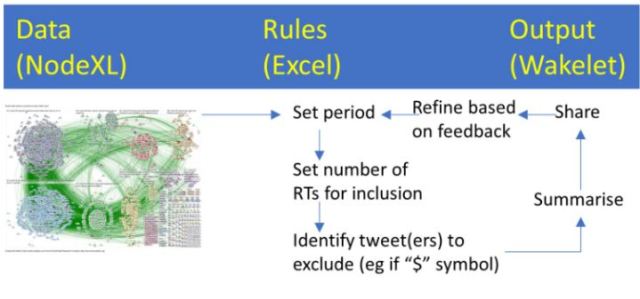
“Top tweet” method of summarising health conferences (@gmacscotland)
We live busy lives. Social media is a black hole that can suck valuable time.
A simple rule based approach to identifying “top tweets” can help identify popular and/or controversial content (eg from a conference or campaign).
The rules can be adapted according to topic and context – for example, to exclude tweets from a spam account, tweeters with commercial interests in the topic.
The outputs can provide valuable CPD, without having read the majority of tweets or attended the conference or watching in on the campaign. There are other lessons that we can learn from these data. (Read the parallels between this approach and Brian Eno’s Discreet Music in this tweet).
So far this summary includes 1) an animated time series of tweets using NodeXL; 2) a comparison of tweeters vs retweeters; 3) some reflections on next steps for #SoMe4Surgery looking at a discrete discussion around #SoMe4Error (including some brief reflections on innovations and digital ethnography); and 4) the start of an exploration of the number of Twitter accounts mentioned in tweets (starting with original tweets – I’ll post information about replies in due course).
Most of the earlier information from my analysis has been tweeted – eg overall summary of 28 July to 27 September, a thread summarising evolving analysis, and other tweets – and is not repeated here.
1. Animation of #SoMe4Surgery tweets
The following video uses information from a NodeXL file and “animates” it in 3 second blocks per 3 days from 28 July (Julio Mayol’s initial tweet) to 27 September 2018. This type of summary is not for the faint hearted – the NodeXL file is massive, with almost 100,000 interactions (tweets, retweets, replies and mentions). Each image for the animation took about 15 minutes to produce.
I had to combine NodeXL extracts to produce the map as the Twitter API provides access to 9-10 days at a time. In the process of combining NodeXL extract the date formatting sometimes gets confused – days and months switch round. You have to adjust for this in analysing data by time – I sort tweets by Twitter ID (the last 19 characters of tweet URLs in these extracts), which allow us to look at data in chronological order, regardless of date format. With a bit of tinkering you can correct the dates if you do need this information.
I have animated the first 3 days in more details – in hour blocks from 8AM to noon on 28 July, then 12 hour blocks to the start of 31 July.
2. #SoMe4Surgery tweeters vs retweeters
Understanding the breakdown of who tweets and/or retweets can help understand wider engagement about #SoMe4Surgery. I used the same data as above for comparison of tweeters vs retweeters (28 July to 27 September 2018).
I have not explored retweeters previously in my analysis of NodeXL extracts, and this required a bit of methodological exploration which will be useful for other analysis.
Method: Analysis of tweets was performed using methods described previously. NodeXL also extracts a “retweet ID” for retweets, but in my extract this has been turned into scientific notation; some of the detail has been lost in the process – in this case the final 4 digits – (eg 1.02E+18 becomes 1023126243053650000, with the final 0s replacing the original numbers). I have circumvented this by sorting by retweet IDs (level 1 of sort), retweeter name (level 2 of sort), and date and time of the retweet to the nearest second (level 3 of sort). This should identify individual retweets quite accurately and I will compare this in the future with an extract with full “retweet ID” information available (*).
Results: The analysis of retweets gives information on 15,847 retweets by 1,881 retweeters. This is a little short of the figures available on the basis of information extracted separately from #SoMe4Surgery tweets (total of 8,178 tweets by 483 tweeters with 17,241 retweets). We therefore have information about retweeter for 92% of retweets.
Using the data from the analyses of #SoMe4Surgery tweeters and retweeters:
- 2,033 Twitter accounts have tweeted and/or retweeted
- 331 accounts have both tweeted and retweeted
- 152 accounts just tweeted
- 1,550 accounts just retweeted
Details about the top 30 tweeters (figure 1) and top 30 retweeters (figure 2) are shown below. Many of the top tweeters were also among the most prolific retweeters. Of the top 30 retweeters, all but 4 also posted tweets about #SoMe4Surgery.

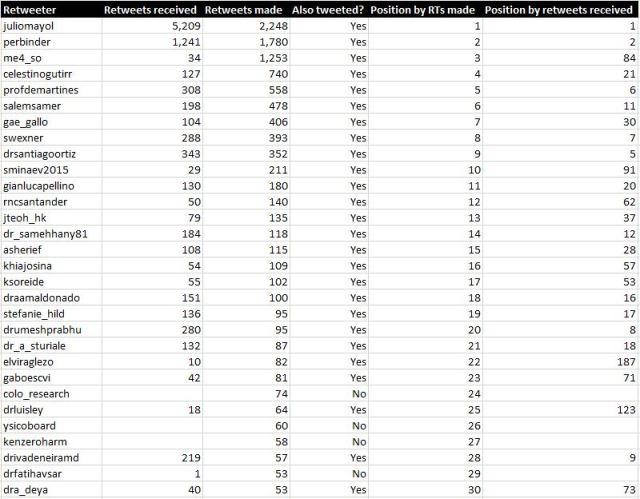
Discussion and conclusions: Details about individual tweeters can be extracted from the NodeXL extract to a reasonably high level of accuracy. The number of tweeters and retweeters stated above are lower estimates of #SoMe4Surgery activity. Note, also, that they only include tweets using the hashtag and Julio Mayol’s original tweet. They do not include replies unless the reply also included the #SoMe4Surgery hashtag. Some of the “just retweeted” group may well have had replies that are not recorded in this dataset.
This analysis suggests that of people posting original #SoMe4Surgery content (i.e. tweeters), 31% (152/483) did not retweet other people’s posts. Furthermore, the great majority of people interacting with #SoMe4Surgery (76%) were retweeters rather than tweeters.
These data do not tell us why some tweeters have not shared (i.e. retweeted) other people’s tweets. Nor do they tell us why the majority of people appear to have retweeted without posting their own content.
NodeXL provides a way to quantify the scale of tweeting and retweeting, and provides an opportunity to categorise Twitter accounts by the type of engagement (just tweeted, tweeted and retweeted, just retweeted). This information could potentially be used to engage with participants to assess the impact of #SoMe4Surgery so far, and suggestions for future developments, but this would need to be gauged carefully to avoid intrusion.
3) Thinking big and starting small for #SoMe4Surgery
The Mayo Clinic Center for Innovation has a useful motto: “think big, start small, move fast”. This has been adapted for “quality improvement” (QI) work in healthcare (small incremental changes using PDSA cycles) to:
think big, start small, test fast
This approach can be used to structure thoughts on #SoMe4Surgery.
When Julio Mayol first tweeted his idea about a social media movement for surgery (28 July 2018) the idea spread very quickly. It might, therefore, seem difficult to “start small”, 8 weeks on. However, in order to test ideas, and refine our approach, we need to do just that. The good news is that we do not need to stop tweeting about #SoMe4Surgery to do it.
Using QI methodology, “population segmentation” allows us to focus down to a smaller scale. Borrowing from another discipline (epidemiology) we can look beyond just “population” to think about “time, place and person“. In this example I’m going to extend this framework to segment by time and topic, looking at just #SoMe4Surgery tweets posted during the #SoMe4Error Twitter chat on 10 October 2018.
Clicking on the link in the previous sentence takes us to just those tweets, listed in reverse chronological order. Giving the page enough time to load (may need to scroll down) lists all the tweets posted using both hashtags during that period. As a quick Twitter tip, you can estimate the number of tweets posted by searching for “#SoMe4Surgery” (press “control F” to find and enter search term and you’ll see the number of times #SoMe4Surgery is mentioned – n=69 tweets after removing two other occurrences of the search term that were not in tweets – click to see further detail). This feels like a manageable number to read, even when you add in replies to these tweets. As a further Twitter tip, you can see the most popular tweets by clicking “top” (though the results may vary over time), and scroll down through the replies to see additional posts that did not use the hashtag(s): eg this tweet by Susannah Hill.
Following the above steps gives us a considerable volume of tweets – perhaps 90-100 tweets and replies. We need to explore these tweets in detail to gain meaningful insights. This brings us to a different discipline again: digital ethnography. The social media tools that I have shared so far during the #SoMe4Surgery analysis have looked at volume of tweets (Followthehashtag, NodeXL, TAGS), with some attempts to summarise “top tweets” (the most retweeted posts that used the hashtag).
However, to think of the whole body of #SoMe4Surgery tweets as a sphere, the tools we have used so far really just describe the “surface”. If we want to describe the “whole” we need to look deeper into tweets and replies that did not necessarily use the hashtag.
Tweets and replies that did not use the hashtag are not captured by social network analysis tools. Hand sorting through the tweets and the replies and tweets that quote these tweets is important. (Quoted tweets are not collected by social network analysis tools if relying simply on a hashtag search. The level of quoted tweeting can be considerable for a popular tweet – eg this tweet by Helen Bevan. You can map the level of quoted tweeting using NodeXL by adding in the URL and unique text from the tweet). Once you have a record of all the tweets, replies and quoted tweeting you can then start to perform a qualitative analysis, exploring the themes that arise in discussions. In social media analysis this is called digital ethnography. A paper by Joanna Taylor and Claudia Pagliari describes the application of these techniques to a discrete body of tweets, in this case the final tweets of geriatrician and cancer patient Dr Kate Granger. Describing the inclusion criteria and number of tweets is only the very start of a process in describing the insights that can be gleaned from social media analysis. Exploring the content and meaning takes us much further.
The purpose of describing the findings of tweets on a single topic is two fold: to learn from the content in its own right (in this case the topic of surgical error); and to improve future tweeting about #SoMe4Surgery. The “test fast” of the motto introduced above will involve generating ideas (or hypotheses) and testing them quickly using PDSA (plan and predict, do, study, act) cycles. The key word here is “predict”. What do you think will happen when you make a tweak to your approach (tweeting or otherwise)? How does the reality compare with that prediction. Read more on quality improvement here.
So, building on this quick skip through simple insights derived from the worlds of innovation, quality improvement, epidemiology and digital ethnography, the #SoMe4Surgery community should consider:
- Extracting details about each of the #SoMe4Surgery #SoMe4Error tweets (I will run a NodeXL extract to list these tweets)
- Extracting details about each of the replies to these tweets, and tweets quoting these tweets
- Using methods described in Taylor and Pagliari’s paper to study these tweets and replies in detail
- Reflecting on the findings – what worked, what didn’t, what else might have been tried – to generate some ideas for testing with a future #SoMe4Surgery activity.
This will be a considerable piece of work – it would ideally need a student to dedicate a few days to design and perform a preliminary analysis.
In the interim, you can read an automated report on #SoMe4Error tweets using Followthehashtag. This provides some additional information, mapping the tweets and retweets geographically and estimating gender split.
4) Number of twitter accounts mentioned in original tweets
This analysis took a few days to work out and refine. I have already quantified the number of tweeters and retweeters in the NodeXL extract (28 July to 27 September 2018). I set out to document the number of people mentioned in original tweets (not replies, which are identified as starting with an “@” symbol).
Raw data from tweets (eg text, tweeter) are available from various social analytical tools for analysis in Excel (eg NodeXL, TAGS, Followthehashtag, Twitonomy). Excel does not provide a function to automatically split text neatly into its constituent parts. There are too many tweets to make this a manageable task manually.
I have presented two methods here: the first using the text in the tweet (as would be required for TAGS, Followthehashtag and Twitonomy data). The second using extra detail available in NodeXL extracts. I have used NodeXL data in describing both methods below to compare results for the two methods.
Method 1) Extracting “mentions” from tweet text.
I estimated the number of people mentioned in a tweet by counting the number of “@” symbols in a tweet using the “substitute” command in Excel. There were up to 21 mentions in an individual tweet. I noticed during the course of this work that some of the tweets listed in my combined NodeXL extract had lost details about the text in the tweet (due, I think, to changes in NodeXL columns sometime during September). I therefore had to go back to the original NodeXL extracts to locate that text. The figures shown here (figure 3) are, therefore, slightly different to the preliminary results that I shared previously on Twitter.
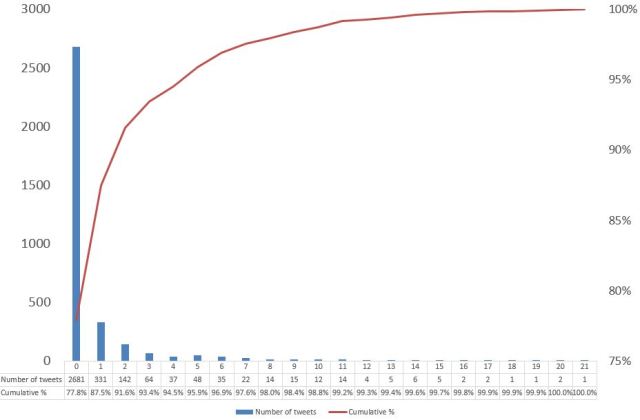
I removed line breaks in tweets (using substitute command and char(10) for line breaks). I then used Excel text commands (eg “Mid” and “Len”) to identify the up to 21 mentions in individual tweets. This required a few extra steps that could be automated (eg removing punctuation marks) plus some hand searching of the final results. The end result, while still an estimate(+), appears to be reasonably accurate.
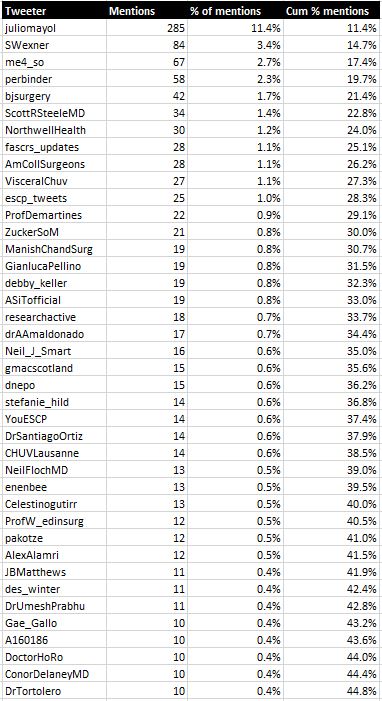
Based on this analysis there were 782 people mentioned in original tweets (not replies) that used the #SoMe4Surgery hashtag. Overall, 294 accounts (38% of accounts mentioned) made up 80% of this number. In total there were 2,505 mentions of Twitter accounts in tweets. The top 40 mentioned accounts are listed below (figure 4).
Method 2) Using extra data collected in NodeXL
This method of finding the number of tweeters mentioned in tweets is much quicker, but requires a NodeXL extract. NodeXL captures details about tweets, mentions and retweets. Extracting the following columns from the “Edges” worksheet of a NodeXL report gives us all the information that we require with a little further sorting (similar to the method for studying retweeters in section 3 above):
- Column C: Vertex 1 (the tweeter)
- Column D: Vertex 2 (for our purposes this will be another tweeter mentioned in the tweet)
- Column E: The text of the tweet itself (we’ll use this to identify if it’s an original tweet or a reply; the latter begins with an “@”)
- Column F: Twitter page for tweet
- Column G: Retweet ID
Follow these steps:
- Use “retweet ID” to sift out the retweets then delete this column.
- Make Column G a column called “Mention?”. Search for tweets with “mentions” by searching for vertex 2 in the tweet text. Remember to add an “@” symbol: =SEARCH(“@”&D2,E2). Don’t worry about the “#VALUE!” results. We use them later to find tweets with no mentions.
- Make Column H a column called “Reply?” Search for replies that start with an “@” symbol: =IF(LEFT(E2,1)=”@”,1,””). You may need to sift out other stray characters that sometimes get added to tweets but are invisible when viewing in Twitter: eg I found a couple of tweets with a symbol “LRI” followed by an “@” symbol, that were replies on further inspection.
- Sort the tweets using Twitter page for tweet (level 1 of sort) then Vertex 2 (level 2 of sort).
- Set up a column called “Duplicates”. Remove duplicates where Twitter page and Vertex 2 are the same: =IF(AND(F2=F1,D2=D1),1,””). Sort by Duplicates, remove duplicate rows and then delete duplicate column.
- After removing duplicates, name Column I “Mentions (working)” and set this up to equal zero, unless the Twitter page for the row above is the same as the current row, in which case you add one to “Mentions (working)” from the row above. =IF(ISNUMBER(G2),IF(F2=F1,I1+1,0),””).
- Column I counts up number of mentions in individual tweets. We need to take the highest value. Set up a column called “Highest number of counts” (Column J). Use this formula to find the highest value, even if that value is zero: =IF(AND(F2<>F1,F2<>F3),I2,IF(OR(I2>I3,I3=””),I2,””))
- The result in Column J is one short of the actual number of mentions. Label Column K as “Number of mentions” and add one to value of Column J: =IF(J2<>””,J2+1,””)
- Label column L as “Zero mentions”. Identify tweets with no mentions by looking for the #VALUE! results in Column G: =IF(ISNUMBER(G2),””,1)
- Add columns M: “Tweet or reply flag”: =IF(OR(K2<>””,L2<>””),1,””); N: “Mention or not”: =IF(ISNUMBER(G2),”MENTION”,”No MENTION”); O: “Reply or tweet”: =IF(H2=1,”REPLY”,”TWEET”)
- You can now run pivot tables to look for number of mentions of tweeters, for replies and original tweets.
This is a much quicker method than the original approach, but requires a working understanding of how NodeXL works as summarised above. The results are reassuringly similar to method 1 (if you’re working with tools other than NodeXL). The results for method 2 should be considered the gold standard.
Method 2 identifies 8,178 tweets:
- 3,444 original tweets of which 760 (22%) mention a total of 778 tweeters
- 4,734 replies, mentioning 1,529 tweeters.
You can see the results in this tweet (NB final point on “replies” Pareto is mislabelled, but corrected in Excel sheet).
More detail about wider analysis will be posted on this page over coming weeks.
Graham Mackenzie, Consultant in Public Health Medicine, 9 October 2018, updated with tweeters versus retweeters analysis on 10 October 2018, section on thinking big but starting small on 11 October 2018, and section on number of Twitter accounts mentioned in original tweets on 17 October 2018.

(*) Footnote to section 2 (tweets vs tweets analysis): NodeXL imports the full retweet ID. The detail is lost when combining extracts using GraphML files (last 4 digits lost in converting to scientific notation). #SoMe4Surgery extracts (typically extracted 9-10 days at a time) had to be combined as GraphML files to allow mapping over the 2 month period. There may be a way to override this.
Checking another related extract that had been extracted de novo and without further modification (#ESSO38) there were 460 retweets identified by 113 tweeters using retweet ID going back to 30 September 2018. Using my original method, based on tweets, there were 166 tweets by 42 tweeters with 467 retweets; as NodeXL also captures earlier posts retweeted during the period of study (Sunday, 30 September 2018 at 19:09 UTC to Wednesday, 10 October 2018 at 20:34 UTC) there were two earlier posts (5 July with 4 retweets and 27 September also with 4 retweets) included in these figures. This is a marked improvement on the 92% accuracy achieved for #SoMe4Surgery retweets using my alternative method described above.
A method based on full retweet ID would therefore appear to be the most accurate approach. The original unmodified NodeXL extracts for #SoMe4Surgery are available on the NodeXL Graph Gallery website and could be re-analysed (eg see the first NodeXL map here and scroll down to bottom of page to download file as NodeXL workbook).
(+) Footnote to section 4: eg people will sometimes use the “@” symbol in a tweet as an abbreviation of “at” rather than as the start of a Twitter “handle” (AKA username) and it would take a very considerable effort to identify every instance.
