This post summarises work that we’re presenting at the 28th European Congress of Clinical Microbiology and Infectious Diseases in Madrid, 21-24 April 2018. Download the poster.
Please share during the conference period using the hashtag #ECCMID2018, and tagging the four authors listed below. A more detailed paper for submission to a peer reviewed journal is in preparation.
Toe dipping or immersion? A social network analysis of World Antibiotic Awareness Week 2017
Diane Ashiru-Oredope (Public Health England) , @drdianeashiru
Chris Little (Capital & Coast District Health Board, New Zealand), @drcjlittle
Elizabeth Beech (NHS Bath & North East Somerset CCG, England), @elizbeech
Graham Mackenzie (NHS Lothian, Scotland) (*corresponding author), @gmacscotland
Background: Global health campaigns can generate 10,000s of tweets from 1,000s of individuals and organisations. These campaigns are an opportunity to learn and gather views. However, the volume of information can be overwhelming. World Antibiotic Awareness Week in 2017 (13-19 November) generated huge activity globally. We set out to describe activity looking beyond just the official campaign, and across the world.
Methods: The official global campaign hashtags were #AntibioticResistance and #StopSuperBugs. The European campaign (18 Nov) used #KeepAntibioticsWorking. Our analysis of the 2016 campaign suggested there would also be tweeting using other hashtags or without hashtags. The Symplur website reports tweets/retweets and tweeters/ retweeters in aggregate. In contrast, NodeXL provides raw data on individual tweets and their interactions. We identified the most popular hashtags using Symplur, then ran a series of NodeXL extracts for the week (starting from midnight in New Zealand). Activity for all but 3 hours was obtained in this way and combined (Figure 1). Tweets were ordered by number of retweets, looking at top tweets overall, and then by hour (n=180 in each group).
Figure 1: NodeXL extract of tweets & interactions (see NodeXL Graph Gallery for full data)

Results: #AntibioticResistance was the most commonly used hashtag (Figure 2). The tweeting and retweeting peaked during the second half of each day, corresponding with tweeting from Europe, Africa and the Americas (Figure 3). Activity fell over the weekend, which coincided with European Antibiotic Awareness Day.
| Figure 2: Tweets and tweeters (source: Symplur) | Figure 3: Tweets and retweets, UK times (source: NodeXL) |
 |
 |
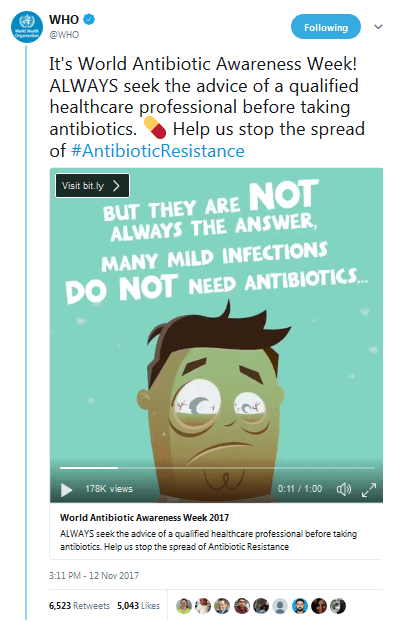
The most shared post (over 6,000 retweets) was posted by the World Health Organisation on the first day (below).
There were 19,183 tweets from 7,897 tweeters, and 73,836 retweets. While 4,060 (51%) tweeters posted 80% of tweets, posts from just 467 (6%) tweeters received 80% of retweets.
Two groups of tweets were selected for further study: the 180 most retweeted posts overall (click to view full list); and a further 89 tweets that were the most shared posts for the hour they were posted (click to view list). The characteristics of tweeters and tweets varied by group (Table).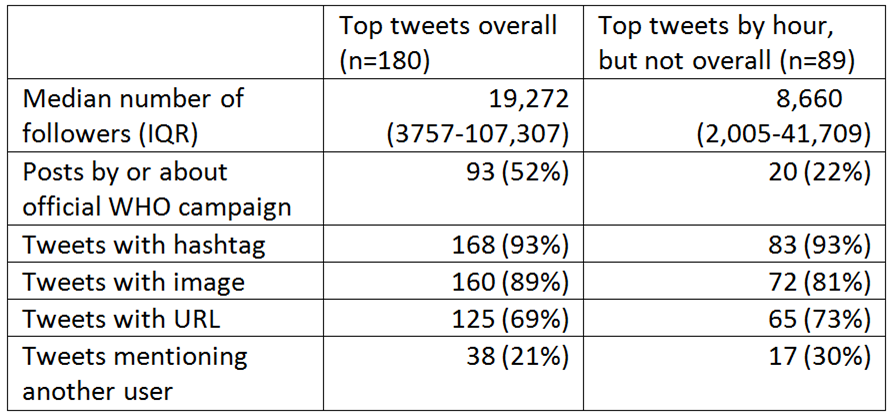
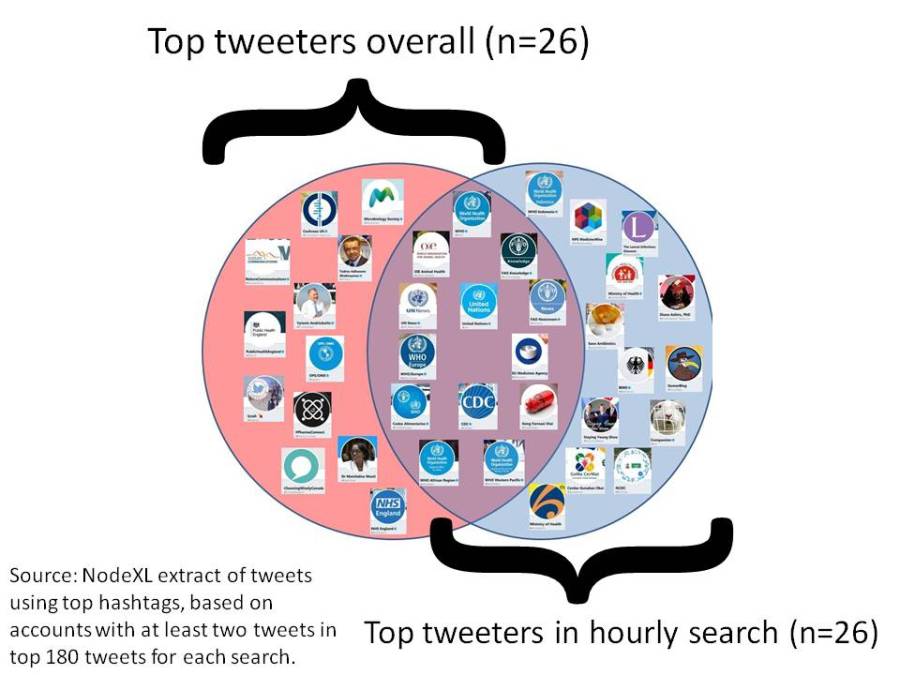
There was overlap between the two groups (Figure 4). WHO and other supranational organisations featured in both lists. There was more diversity identified in the hour by hour analysis, with tweeters from across the world, gindividuals and journals identified alongside government organisations and NGOs.
Figure 4: Top tweeters by search strategy

Discussion: Despite the network of connections in Figure 1, the campaign was dominated by a relatively small group of tweeters. Most top tweets were of high quality: evidence-based, with image/ video, hashtags and URLs, but few tweets mentioned other users. The top tweets were also rather “corporate”, with little new scientific information. Looking beyond top tweets to find other content identified a diversity that was not initially apparent from the official campaign materials.
Read more about the application of social network analysis in healthcare in this blog post.
