A summary of recent “physical activity” tweets taking a person, topic, organisation, network and campaign approach

Introduction: Readers of this blog will know that I have been looking at extracting public health content from Twitter over the past year. In this analysis I bring together a series of NodeXL social network analyses, extracted over the past 2 days, to look at what they can tell us about physical activity and health. I have termed this a “person, topic, organisation, network and campaign” approach (PTONC – pronounced Pétanque perhaps for this physical activity theme?)

This work was prompted by a request by Ann Gates at ExerciseWorks on Saturday 7 October 2017. ExerciseWorks is a prominent physical activity focused Twitter account based in the UK but with a global reach. Ann was interested in demonstrating her Twitter following to a physiotherapy audience and asked if I could produce a NodeXL map (figure 1). I thought it would be interesting from a CPD perspective to look beyond the interactions shown in figure 1 to look at the contents of the most shared tweets, for ExerciseWorks and other NodeXL searches.

Figure 1: @ExerciseWorks NodeXL map 27 Sep to 7 Oct 2017

exerciseworks to 7 oct.png

Source: NodeXL graph gallery

Continue reading “A summary of recent “physical activity” tweets taking a person, topic, organisation, network and campaign approach”

Public Health advocacy in Scotland during 2017

This blog provides a quick summary of two health/ public health advocacy campaigns in Scotland, both launched at Scottish Parliament during 2017.

Advocacy is an important part of Public Health work. The Public Health Advocacy Institute of Western Australia provides the following definition in their advocacy toolkit:

The word ‘advocate’ actually comes from a Latin word meaning ‘to be called to stand beside’. Advocacy can be thought of as “the pursuit of influencing outcomes – including public policy and resource allocation decisions within political, economic, and social systems and institutions – that directly affect people’s lives.”

The “State of Child Health” report was launched by Royal College of Physicians and Child Health on 26 January 2017, with events across the UK, including a RCPCH Scotland event at Scottish Parliament. I have summarised the Twitter activity around that day here.

The “Fairer Lives Healthier Future” call to action was launched by the Faculty of Public Health in Scotland on 20 September, with events at the Royal College of Physicians Edinburgh and Scottish Parliament. Twitter activity during and after the launch is summarised here.

Continue reading “Public Health advocacy in Scotland during 2017”

Quantifying the reach and punch of a single BMJ article on social media

The BMJ cover story on 9 September 2017 explored a Twitter ban at a medical conference in the United States. The article included responses to the Twitter ban from two of the most prominent physician tweeters from the US (Prof Michael Gibson and Dr Kevin Campbell), a couple of comments from me, and social network analysis (SNA) that I had performed looking at the tweets that emerged from the conference.  The analysis showed that the ban itself was a much bigger topic of conversation on Twitter than any clinical or scientific learning from the conference. In this blog I explore the reach and impact of the BMJ article on social media in the days after publication.

Continue reading “Quantifying the reach and punch of a single BMJ article on social media”

The twisty path from studying #Complexity2017 to summarising an American College of Cardiology conference at the request of some of the world’s top medical tweeters

ScotPublicHealth has attempted to bring together insights around public health and social media techniques, with the intention of learning, networking and broadcasting positive and evidence-based messages about health and wellbeing. Over the course of this work I have learnt and refined techniques in extracting and processing large quantities of information from Twitter to source top quality content.

As with any new technique, there is a lot of learning, curiousity and experimentation required. You’re not sure where such work will lead, but you follow your nose. This particular post, which brings together three “big data” analyses over three days, has emerged out of relationships developed on Twitter, and a bit of luck.

Continue reading “The twisty path from studying #Complexity2017 to summarising an American College of Cardiology conference at the request of some of the world’s top medical tweeters”

Using a quick extract of “Air Pollution” tweets to source content for National Clean Air Day (15 June 2017)

My recent blog posts have looked at post hoc analyses of Twitter “big data” to describe conferences and awareness raising campaigns. This blog post looks at how “big data” can help identify high quality content to feature in a forthcoming campaign.

Air pollution, climate change and global warming are highly relevant to Public Health, with an up to date analysis provided in the Global Burden of Disease study in the Lancet. The #AirPollution hashtag is used in tweets throughout the year. I have extracted tweets that mention “air pollution” (from 12 and 13 June 2017) to identify potential content for “National Clean Air Day” on 15 June. The top 60 “air pollution” tweets (by number of retweets at 14:00 UK time on 13 June) are listed in a Wakelet summary. Searching for “air pollution” will identify tweets with the phrase itself or the hashtag. There is a wide range of content here, from Scientific American and Guardian news stories to other articles, infographics and tools, including posts and websites in French and one tweet in Japanese. The Guardian article was the most quoted “air pollution” story from this list. In order to demonstrate the range of people tweeting I have included each of the tweets in the top 60, but moving repeated stories to the end. The content (images, URLs etc) can be explored and used in new tweets specifically for the National Clean Air Day campaign.

air pollution guardian article
Source: Guardian website

Continue reading “Using a quick extract of “Air Pollution” tweets to source content for National Clean Air Day (15 June 2017)”

Guest editing WePublicHealth global public health Twitter feed (28 May to 4 June)

Between 28 May and 4 June 2017 I guest edited the Twitter feed for the second time. Read blog from guest editing this global Public Health blog the first time (January 2016).

This time round I used Twitter “big data” to source the best tweets and related materials from around the world on a series of Public Health topics, including physical activity, social determinants of health, antibiotic resistance, vaccination, smoking, mental health, and advocacy, introducing a new topic each day. I took the “big data” outputs and produced simple summaries on each topic. Find out more about the techniques I used in this blog on Immunization Week last month.

On 31 May I tweeted live from the Royal College of Physicians Edinburgh conference “Public Health in a Changing World” (hashtag , programme here).

Read a short summary of each day’s activities below. From grassroots advocacy to global awareness campaigns this provides a whirlwind tour of recent Public Health work across the world.

Graham Mackenzie (@gmacscotland on Twitter)

Consultant in Public Health

4 June 2017

Cynergy_Graham MacKenzie_509 (1)

(Photo taken from Inverleith Park, north Edinburgh, looking south over pond to Edinburgh Castle and Arthur’s Seat, evening of 2 June 2017)

Continue reading “Guest editing WePublicHealth global public health Twitter feed (28 May to 4 June)”

Using Twitter big data to study global Public Health campaigns (Immunization Week: #VaccinesWork)

It is almost 50 years ago since “Our World”, the first live international satellite TV broadcast, most famous for the first performance of The Beatles’ “All You Need Is Love” (25 June 1967). The show reached an audience of 400-700 million. The most famous band on earth beamed out to living rooms across the world. This was an impressive achievement, but the information flowed just one way. The digital revolution was yet to happen.

Between 24 and 30 April this year Immunization Week tweets using the #VaccinesWork hashtag passed across devices almost 1.5 billion times(1). Information flowed in both directions – international and national health organisations promoting vaccination, and individuals responding and sharing information of their own. The overall impression of Immunization Week is an extremely well planned and organised multi-agency international campaign, with plenty of evidence-based tweets using images and links to informative webpages. There were tweets by national organisations that provided country specific information. There was also a considerable amount of high quality and informative tweeting at individual level, by clinicians, parents and many others, though these posts risked being overwhelmed by tweets from international organisations in the “big data” analysis.  While there was some negative tweeting by anti-vaccination campaigners, some of them with considerable reach on social media, the balance overall was firmly in favour of vaccination.

This blog summarises the main findings of the big data analysis, pulls out some detail (eg top tweets and resources, the type of influence exerted by top tweeters), and describes the methodology (basic and advanced) so that others can repeat this type of analysis on other global health campaigns. The big data techniques include NodeXL maps, similar in appearance to the spread of communicable diseases (figure 1), except in social media analysis spread is usually seen as a positive. I have used two Public Health evaluation frameworks to summarise main findings (Donabedian’s Structure, Process and Outcome; and RE-AIM).

Herd Immunity
Figure 1. Explaining herd immunity in 6 seconds via IFL Science

Continue reading “Using Twitter big data to study global Public Health campaigns (Immunization Week: #VaccinesWork)”

Quality2017: watching in via Twitter

I can’t think of a better starting point for learning about quality improvement than the International Forum on Quality and Safety in Healthcare. Run by Institute for Healthcare Improvement (IHI) in Boston and the BMJ this huge quality improvement Forum attracts interest and expertise from across the world, with something for everybody, from beginner to quality improvement champion.

This year the Forum ran from Wednesday 26 to Friday 28 April in London. The Wednesday was an “experience day” – the Forum itself was on Thursday and Friday, with the theme ‘Ingniting Collective Excellence’. To quote from the Forum website: “We focus on how the power of collaboration can inspire all parties, including patients, families, new healthcare professionals and improvement leaders to deliver top quality, person-centred care in a sustainable framework.” This was an ambitious theme that anybody working in, or cared for by healthcare systems across the world, could get behind.

I have attended two Forums – Paris 2008 and Gothenburg 2016. A novice in Paris (presenting research rather than quality improvement), I was pleased to present quality improvement work on supporting low income families in Leith, Scotland at the Gothenburg Forum, which coincided with publication of that work in BMJ Quality Improvement Reports.

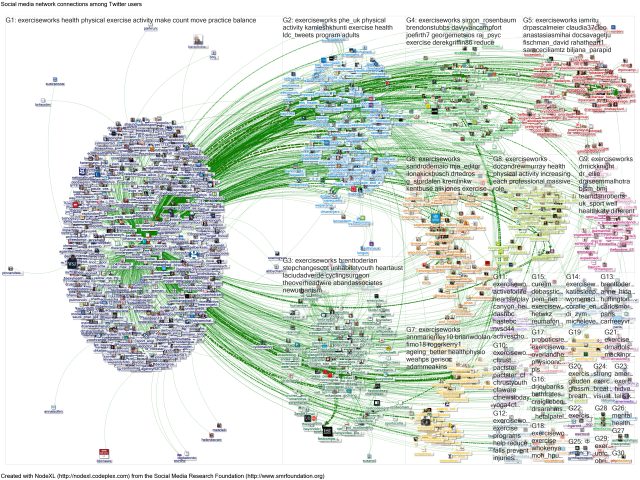
This year I wasn’t able to attend the Forum, but took some time to watch the tweets, retweet some of these tweets, post some ideas of my own, and run a “big data” analysis of the Forum tweets (identified using #Quality2017 hashtag) using NodeXL. See previous blog post and BJSM editorial for more on the methodology used here.

Colleagues interested in quality improvement have been early adopters of social media – almost evangelical in their promotion of Twitter for learning, networking and broadcasting. It is no surprise, therefore, that there are rich pickings from the tweet from the Forum. See Gill Phillip’s summary, capturing a flavour of the tweets. The snapshot presented in this blog is presented purely as an illustration of the potential (and limitations?) of big data.

Also check out the top 40 tweets in this Wakelet summary.

Continue reading “Quality2017: watching in via Twitter”

What is public health? Some reflections for teaching

From time to time I am asked to explain Public Health to students, colleagues from other disciplines or a more general audience. A traditional approach might be to structure such a session around the three domains of Public Health (health improvement, health protection, quality improvement), building on specific examples:

((+) For an excellent clear description of different types of epidemiology studies see Beaglehole et al’s Basic Epidemiology (free download in multiple languages)).

However, this approach perhaps doesn’t highlight the distinction between individual and population health clearly enough for a general audience. After all, one response to the final example above is to talk about uptake of smoking cessation services and other individual approaches to health. A GP may respond that Maslow’s hierarchy applies to an individual as well as a population – a patient is unlikely to be receptive to ideas about health screening or treatment if they are hungry or worried about their home or job.

As I prepare for a session teaching 4th year medical students this week I am keen to try something different, though informed by these and other key Public Health topics. The focus here is on highlighting the differences between approaches to improve individual and population health.

There is a lot of interest to Public Health in the scientific and general press at the moment. For example, over the last few weeks there have been major studies/ stories about the following topics in the world’s top medical journals:

We can learn from commentary around these stubbornly persistent threats to health: eg this individual reflection on diesel fumes and health in the Guardian. Individual response and action is important, and there is clearly a role for behaviour change and medical treatment, but measures to reduce the impact of these global threats to human health will take work at all levels, from individual to supranational and global approaches. In a period of political and economic uncertainty Public Health tools at regional, national and international level (tax, cost, regulation, legislation) are being discussed again, around topics that would have been as familiar Hogarth as to our Public Health predecessors in the Victorian era and first half of the 20th century.

hogarth

(Image from BMJ 29 October 2016)

Continue reading “What is public health? Some reflections for teaching”

Using Twitter to learn from conferences (even when you’re not there): #EPHVienna (European Public Health)

What can we learn from a conference even when we’re not there, using Twitter and some big data analysis? I beamed into the European Public Health conference in Vienna, 9-12 November, to find out…

Continue reading “Using Twitter to learn from conferences (even when you’re not there): #EPHVienna (European Public Health)”