
Between 25 and 28 January 2018 thirty teams of healthcare workers, tech specialists and entrepreneurs will work together to develop new digital innovations in Public Health in a Product Forge hackathon (follow the tweets over the weekend using #PublicHealthPF). I have been asked to provide some thoughts in introduction. Preparation will be important for all participants, so here is my initial advice under 4 headings. You can view the presentation that I have produced for the event here (I also plan to record this as a short “film”).
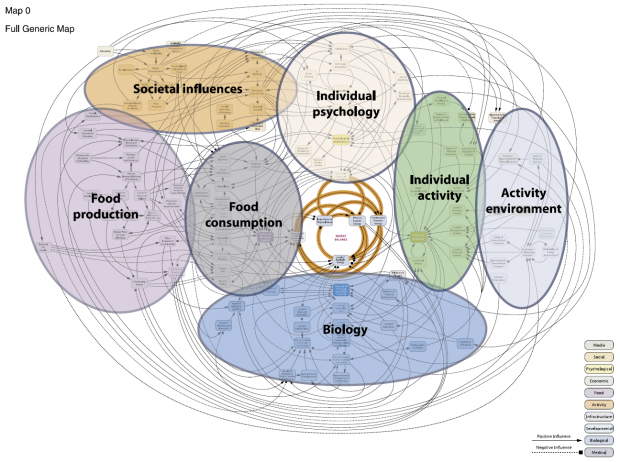
1. There are rarely simple solutions to complex problems. Many public health challenges are very complex. This map from the Foresight report on obesity, 2007, demonstrates the intersectoral, interconnected, multifactorial and competing influences on obesity at a population.
Inequalities represent a similarly knotty problem.
However, all too often politicians and policy makers will reach for simple solutions. And academics will frequently study a single intervention among many potential influences. This is not a criticism – these are natural responses to different priorities including the electoral cycle, public opinion, finances and editorial policy.

Sir Michael Marmot, in his 2010 report on health inequalities – Fair Society Healthy Lives – describes the concept of “lifestyle drift” (read more here), which is an important manifestation of the tendency to reach for simple solutions. Efforts to improve population health will often start at a whole system level, for example in tax and fiscal measures, town planning, or in food chains and production. However as the work progresses it is all too easy to drift into focusing solely on individual behaviours and lifestyle – for example covering up baby buggies rather than tackling car manufacture and reducing car use to improve air quality.
In developing digital innovations it is important not to fall into this trap. There are already more than enough apps looking at individual health and wellbeing, whether the number of steps taken per day, power curves or quality of sleep. In addition, there are questions about the accuracy of these apps at the individual level, and important limitations in using such apps to understand population health.
2. Think big, start small, test fast. The Mayo Clinic Center for Innovation provides a helpful tagline for innovation: “think big, start small, move fast”. I update this in my blog on quality improvement in 4 objects, to bring out the importance of testing.
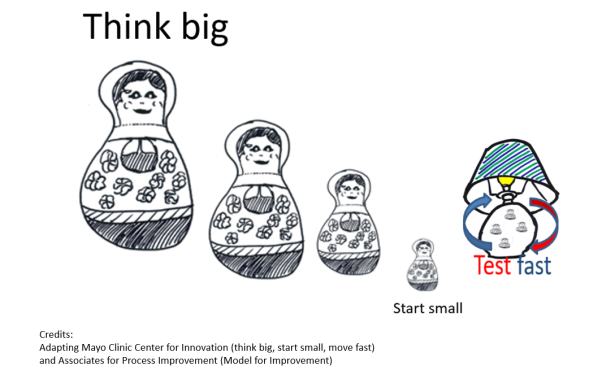
Let’s start with “start small“: in healthcare the smallest unit for testing is typically the clinician/ patient interaction, for example a single question at a crucial point in the care pathway. A clinician can test and refine that question several times over the course of a clinic or ward round using the PDSA (plan and predict, do, study and act) cycle, until it becomes reliable enough for general use, as described in the #QIin4Objects blog. That improvement in process (eg in coverage, uptake or documentation) is a necessary step towards achieving an improvement in health outcome.
In digital innovation “starting small” might be trying to establish connection between two digital record systems for a single patient, or testing out the wording of a field on a questionnaire with colleagues or members of the public.
The main point is that this small testing starts to crack open complex systems that initially felt overwhelming and too big.
“Think big” reminds us to be clear about our overall aim: we might start testing at a small level, but we maintain our focus on our overall aim, which relates directly to a population health outcome. We can think of levels of influence, the key people to involve at each level, measures to record, and ideas to test.
We might, for example, have the overall aim of reducing travel related health problems at a whole country level (injury, morbidity and mortality related to road traffic accidents, air pollution, and sedentary behaviour). Working with your team you identify influences that could drive change (“drivers” if you’ll excuse the pun), which might include street layout and lighting, speed reduction, car design, tax and pricing of public transport, incentives to walk and cycle and so on. Test your ideas to check to guard against slipping into “lifestyle drift”.
The Russian dolls represent levels from supra-government bodies to individual citizen. You can start to identify organisations and people to influence at each level. The European Union could enforce standards for car manufacture or air quality; a country’s government could increase taxes on fuel; a local authority could introduce low emissions zones or 20mph zones; large employers could introduce policies and incentives to encourage walking and cycling; transport officials could change traffic signal sequencing or explore geographical data about pollution levels; police and health data about individual collisions could identify hot spots for further attention. Think through ideas that you can influence rapidly (“push on open doors”) and how they will contribute towards your overall aim.
Once you have your overall aim, and areas for testing, “test fast” is your dynamo for innovation. Don’t worry about “failing” or going up blind alleys. Testing fast, at a small level, is usually low risk, both in terms of time and cost.
Perhaps you decide to develop an app to map safe and low pollution routes from point A to point B. Though focused on individual behaviour (and therefore potentially lifestyle drift), you can see how, in theory, it could build to achieve the overall aim: using and improving data on air pollution and road traffic accidents could shape policy and help enforce standards; increasing cycling and walking could reduce traffic on the roads and therefore reduce pollution and accidents, and encourage further active travel; a healthier workforce could be more productive and take less time off work. You will only know if this is possible, and achievable in practice, if you test, and test fast and repeatedly.
You might, for example, set out to use NHS Emergency Department data to find casualty hot spots, only to discover that data are not currently recorded accurately enough. That then becomes an area for further testing and innovation. For example:
- Can smartphones held by police, ambulance staff, patients and/or A&E staff help collect data about road traffic accidents – eg precise location?
- Can that location and data from the Met Office provide information on likely road conditions using temperature, rainfall, glare of the sun?
- Can that information in turn be used to improve knowledge of safe routes?
- Who holds this information, and can it be accessed in real time to power the app? If not, are there patterns in recent pollution or road usage data that can provide a reasonable estimate?
- Do patterns emerge that would allow novice cyclists to pair up with more experienced cyclists; how are these pairings best organised?
These are just examples, but they illustrate the battle rhythm of generating and testing ideas, and the type of information that might be useful to gather ahead of the hackathon itself. Some initial testing may well take you in unexpected directions.
You may also identify ways to collect new data using the methods you have developed: individual pedestrians and cyclists could potentially submit geographically precise data that can flag up potential problems in advance, for example a stray tree root, dangerous drain cover, a well used footbridge that is slippery when wet, or a “near miss”.
3. Averages are the enemies of progress. Take the example of life expectancy: the Edinburgh health and wellbeing profile shows that male life expectancy at birth in Edinburgh is 77.9 years, which is above the Scottish average of 77.1 years.
Moving to smaller area reporting, however, shows stark contrasts – for example in Niddrie in south east Edinburgh the figure is 68.3 years, while in Colinton and Kingsknowe in south west Edinburgh the figure is 83.3 years (see key below spine charts for further explanation). The striking differences between areas show the pervasive impact of health inequalities, and also some of the reasons for these differences (click on links above for the full small area summaries).


The Marmot review of 2010 shows that it is not just the gap between most deprived and most affluent that is of concern. It is the difference at each successive increment – the gradient. In Scotland the summary measure is Scottish Index of Multiple Deprivation (link provides open access to small area SIMD scores), which uses data on 38 indicators in 7 domains including income, employment, education and health, to score each of the 6,976 postcode areas in Scotland. For many measures there is a step-wise reduction in health and wellbeing as you move between deprivation categories from most affluent to most deprived. See my blog “what is public health?” for more reflections on public health, social determinants of health and health inequalities. You may also find “Edinburgh by Numbers” by City of Edinburgh Council helpful in understanding wider statistics for the city, but look out for examples where averages can be unhelpful and seek smaller area data when possible.
4. Routinely-collected data, by itself, is often not enough. It is tempting to see existing routinely-collected or “administrative” data as a quick, cheap and easy route into understanding and monitoring health and wellbeing, and evaluating impact of interventions.
However there are frequently important limitations that emerge from initial exploration. Data in national reports are typically a year or two old and reported in aggregate (eg whole local authority or health board area). Information required to answer a specific question work may be incompletely recorded (eg trauma data in example above) or not available at all. Even at small area level the data may simply tell you what you already know – for example that outcomes are worse in areas of multiple deprivation.
Record linkage is one way to boost the learning available from routinely collected data – for example linking hospital admission data to specially collected audit data in the trauma example above. Record linkage is rarely entirely accurate, so caution is required in the interpretation and analysis. The process of linkage also takes time, which may limit the usefulness of the data in innovation.
Qualitative data – for example from surveys, interviews or focus groups – may help generate ideas for further exploration, and can help to “triangulate” when used in conjunction with the routinely collected quantitative data. However, qualitative data can be expensive to collect and analyse on an ongoing basis, particularly for larger studies.
Administrative data from other sources can potentially be useful in powering innovation work. “Big data” approaches can potentially provide near real-time insights. However, such analysis can raise ethical concerns (read this example about a large US retailer). Initial promise (eg with Google Flu Trend data) can ultimately disappoint, as illustrated by researchers in this Wired article; the researchers highlight the challenge of “big data hubris” but also the lack of transparency in the black box workings of big tech companies.
In conclusion, simple “fixes” are unlikely to provide useful or innovative solutions to public health problems. That is not to say that the products emerging from the hackathon should be complicated to use – quite the opposite. The EAST framework for behaviour change provides us with some useful headings that are also useful to consider when planning digital innovation: is the product Easy and Attractive to use, Social (think about opportunities for wider data collection)and Timely (think about the timescale of accessing and reporting data)? Products that meet these criteria are more likely to achieve regular and sustained use.
There are clear parallels here with the following statement on the BMJ Innovations journal website:
The journal champions research that offers new, cost-effective medical devices, technologies, processes and systems that improve patient care. It aims to promote innovations that make healthcare accessible and affordable, creating a community that aspires to make the world a healthier place.
Products emerging from the hackathon should also be centred on population health outcomes, the workings should be well described and transparent, and they should be accessible at no or low cost to a wide audience. Ideally the product should be open source to allow rapid development beyond the hackathon. Successful products are likely to be the result of a team of people who wouldn’t normally work with each other, but will be keen to continue to keep working together after the event. And though the result of a lot of hard work – both in conception and development – the ultimate products should invoke the response: “Now, why didn’t I think of that”.
Dr Graham Mackenzie, Consultant in Public Health, NHS Lothian, 21 December 2017

